667 Tiger Lily Way Highlands Ranch, CO 80126
Westridge NeighborhoodEstimated Value: $912,806 - $999,000
4
Beds
4
Baths
3,306
Sq Ft
$287/Sq Ft
Est. Value
About This Home
This home is located at 667 Tiger Lily Way, Highlands Ranch, CO 80126 and is currently estimated at $950,452, approximately $287 per square foot. 667 Tiger Lily Way is a home located in Douglas County with nearby schools including Stone Mountain Elementary School, Ranch View Middle School, and Thunderridge High School.
Ownership History
Date
Name
Owned For
Owner Type
Purchase Details
Closed on
Jul 21, 2017
Sold by
Green Kenneth and Green Carol C
Bought by
Kevin J Harney And Gina T Harney Trust O
Current Estimated Value
Purchase Details
Closed on
Jul 9, 2015
Sold by
Holbert Robert M and Holbert Rebecca S
Bought by
Green Kenneth and Green Carol C
Home Financials for this Owner
Home Financials are based on the most recent Mortgage that was taken out on this home.
Original Mortgage
$412,500
Interest Rate
3%
Mortgage Type
Adjustable Rate Mortgage/ARM
Purchase Details
Closed on
Oct 11, 2012
Sold by
Richmond American Homes Of Colorado Inc
Bought by
Holbert Robert M and Holbert Rebecca S
Home Financials for this Owner
Home Financials are based on the most recent Mortgage that was taken out on this home.
Original Mortgage
$417,000
Interest Rate
3.55%
Mortgage Type
VA
Create a Home Valuation Report for This Property
The Home Valuation Report is an in-depth analysis detailing your home's value as well as a comparison with similar homes in the area
Home Values in the Area
Average Home Value in this Area
Purchase History
| Date | Buyer | Sale Price | Title Company |
|---|---|---|---|
| Kevin J Harney And Gina T Harney Trust O | $609,900 | Chicago Title | |
| Green Kenneth | $550,000 | Land Title Guarantee | |
| Holbert Robert M | $417,500 | None Available |
Source: Public Records
Mortgage History
| Date | Status | Borrower | Loan Amount |
|---|---|---|---|
| Previous Owner | Green Kenneth | $412,500 | |
| Previous Owner | Holbert Robert M | $417,000 |
Source: Public Records
Tax History Compared to Growth
Tax History
| Year | Tax Paid | Tax Assessment Tax Assessment Total Assessment is a certain percentage of the fair market value that is determined by local assessors to be the total taxable value of land and additions on the property. | Land | Improvement |
|---|---|---|---|---|
| 2024 | $6,155 | $68,990 | $12,280 | $56,710 |
| 2023 | $6,144 | $68,990 | $12,280 | $56,710 |
| 2022 | $4,524 | $49,520 | $8,910 | $40,610 |
| 2021 | $4,706 | $49,520 | $8,910 | $40,610 |
| 2020 | $4,224 | $45,540 | $5,690 | $39,850 |
| 2019 | $4,239 | $45,540 | $5,690 | $39,850 |
| 2018 | $3,654 | $38,660 | $6,900 | $31,760 |
| 2017 | $3,327 | $38,660 | $6,900 | $31,760 |
| 2016 | $3,241 | $36,960 | $6,880 | $30,080 |
| 2015 | $3,310 | $36,960 | $6,880 | $30,080 |
| 2014 | -- | $33,250 | $9,150 | $24,100 |
Source: Public Records
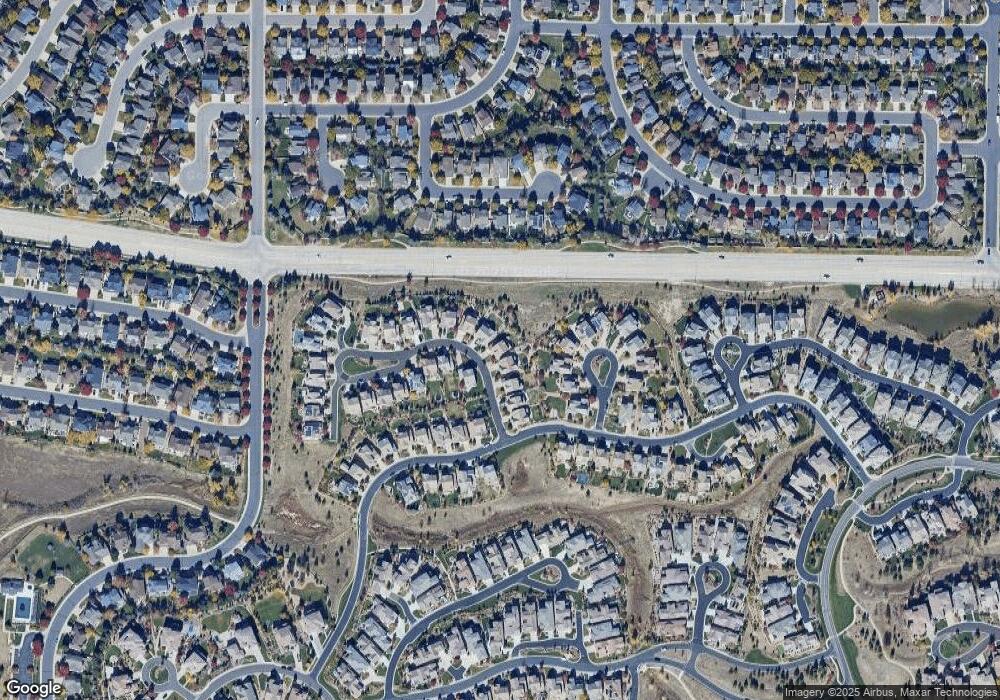
Map
Nearby Homes
- 664 Tiger Lily Way
- 468 English Sparrow Trail
- 10414 Maplebrook Way
- 469 Stellars Jay Dr
- 10544 Soulmark Way
- 430 Red Thistle Dr
- 10640 Star Thistle Ct
- 10123 Mockingbird Ln
- 10060 Royal Eagle Ln
- 380 Rose Finch Cir
- 1113 Southbury Place
- 885 Sage Sparrow Cir
- 360 Basilwood Way
- 978 Sage Sparrow Cir
- 255 Maplehurst Point
- 288 Maplehurst Point
- 10785 Sundial Rim Rd
- 470 Maplehurst Dr
- 10432 Willowwisp Way
- 10426 Willowwisp Way
- 661 Tiger Lily Way
- 677 Tiger Lily Way
- 10427 Startrail Ct
- 651 Tiger Lily Way
- 10421 Startrail Ct
- 684 Tiger Lily Way
- 683 Tiger Lily Way
- 684 Tiger Lily Way
- 10435 Startrail Ct
- 645 Tiger Lily Way
- 690 Tiger Lily Way
- 637 Meadowleaf Ln
- 687 Tiger Lily Way
- 10445 Startrail Ct
- 649 Meadowleaf Ln
- 694 Tiger Lily Way
- 10411 Startrail Ct
- 691 Tiger Lily Way
- 657 Meadowleaf Ln
- 640 Meadowleaf Ln