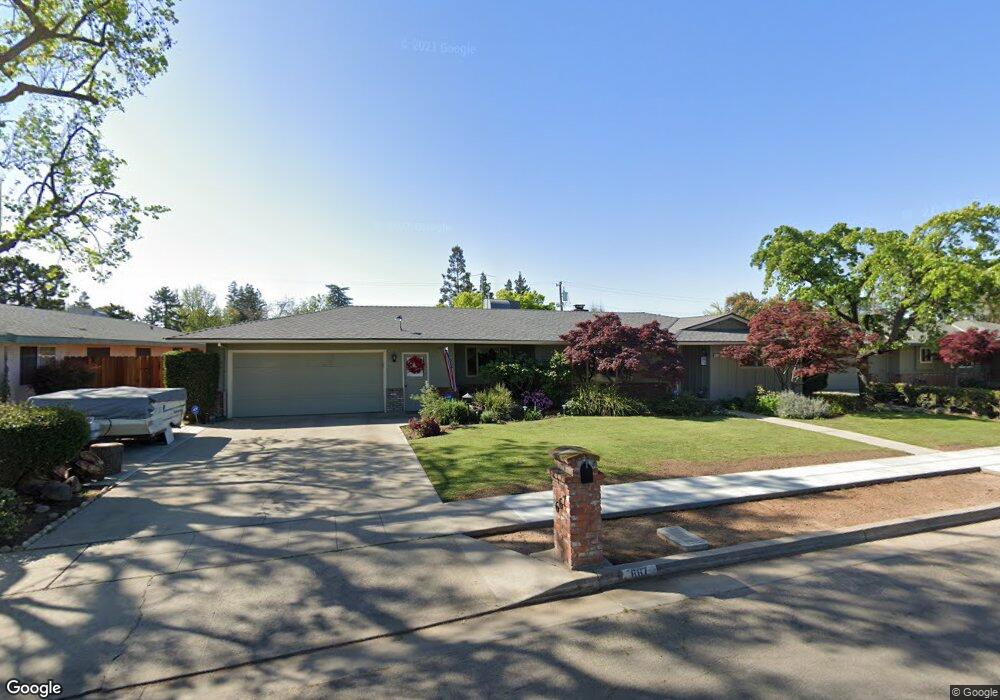
667 W Morris Ave Fresno, CA 93704
Bullard NeighborhoodEstimated Value: $474,000 - $529,680
4
Beds
3
Baths
2,108
Sq Ft
$237/Sq Ft
Est. Value
About This Home
This home is located at 667 W Morris Ave, Fresno, CA 93704 and is currently estimated at $498,920, approximately $236 per square foot. 667 W Morris Ave is a home located in Fresno County with nearby schools including Kratt Elementary School, Tenaya Middle School, and Bullard High School.
Ownership History
Date
Name
Owned For
Owner Type
Purchase Details
Closed on
May 30, 2019
Sold by
Kellerhals Kim and Kellerhals Deborah
Bought by
Kellerhals Kim L and Kellerhals Deborah J
Current Estimated Value
Purchase Details
Closed on
Jan 17, 2008
Sold by
Indymac Bank Fsb
Bought by
Kellerhals Kim and Kellerhals Deborah
Home Financials for this Owner
Home Financials are based on the most recent Mortgage that was taken out on this home.
Original Mortgage
$197,600
Outstanding Balance
$124,794
Interest Rate
6.17%
Mortgage Type
Purchase Money Mortgage
Estimated Equity
$374,126
Purchase Details
Closed on
Oct 26, 2007
Sold by
Lee Alison P and Lee Russell P
Bought by
Indymac Bank Fsb
Purchase Details
Closed on
Nov 13, 2006
Sold by
Schwartz Herbert
Bought by
Lee Russell P and Lee Alison P
Home Financials for this Owner
Home Financials are based on the most recent Mortgage that was taken out on this home.
Original Mortgage
$80,000
Interest Rate
5.86%
Mortgage Type
Stand Alone Second
Purchase Details
Closed on
Oct 7, 1998
Sold by
Herbert Schwartz
Bought by
Schwartz Herbert and Schwartz Jean
Create a Home Valuation Report for This Property
The Home Valuation Report is an in-depth analysis detailing your home's value as well as a comparison with similar homes in the area
Home Values in the Area
Average Home Value in this Area
Purchase History
| Date | Buyer | Sale Price | Title Company |
|---|---|---|---|
| Kellerhals Kim L | -- | None Available | |
| Kellerhals Kim | $247,000 | Lsi Title Agency | |
| Indymac Bank Fsb | $276,300 | Accommodation | |
| Lee Russell P | $400,000 | Chicago Title Company | |
| Schwartz Herbert | -- | -- |
Source: Public Records
Mortgage History
| Date | Status | Borrower | Loan Amount |
|---|---|---|---|
| Open | Kellerhals Kim | $197,600 | |
| Previous Owner | Lee Russell P | $80,000 | |
| Previous Owner | Lee Russell P | $320,000 |
Source: Public Records
Tax History Compared to Growth
Tax History
| Year | Tax Paid | Tax Assessment Tax Assessment Total Assessment is a certain percentage of the fair market value that is determined by local assessors to be the total taxable value of land and additions on the property. | Land | Improvement |
|---|---|---|---|---|
| 2025 | $3,866 | $324,422 | $114,269 | $210,153 |
| 2023 | $3,790 | $311,827 | $109,833 | $201,994 |
| 2022 | $3,737 | $305,714 | $107,680 | $198,034 |
| 2021 | $3,302 | $272,900 | $96,100 | $176,800 |
| 2020 | $3,016 | $248,200 | $87,400 | $160,800 |
| 2019 | $2,827 | $237,600 | $83,700 | $153,900 |
| 2018 | $2,738 | $230,800 | $81,300 | $149,500 |
| 2017 | $2,586 | $217,800 | $76,700 | $141,100 |
| 2016 | $2,464 | $210,663 | $74,214 | $136,449 |
| 2015 | $2,425 | $207,500 | $73,100 | $134,400 |
| 2014 | $2,268 | $194,400 | $68,500 | $125,900 |
Source: Public Records
Map
Nearby Homes
- 696 W Celeste Ave
- 5672 N Ferger Ave
- 715 W Browning Ave
- 665 W Escalon Ave
- 671 W Sample Ave
- 520 W Barstow Ave
- 6260 N Palm Ave Unit 111
- 6265 N Colonial Ave
- 441 W Sample Ave
- 6300 N Palm Ave Unit 125
- 6300 N Palm Ave Unit 105
- 6164 N Maroa Ave
- 365 W Escalon Ave
- 1229 W Bullard Ave Unit 149
- 1229 W Bullard Ave Unit 105
- 1232 W Mesa Ave
- 5610 N Arthur Ave
- 411 W Vartikian Ave
- 5370 N Maroa Ave
- 1041 W Sierra Ave
- 681 W Morris Ave
- 655 W Morris Ave
- 668 W Celeste Ave
- 654 W Celeste Ave
- 682 W Celeste Ave
- 695 W Morris Ave
- 639 W Morris Ave
- 680 W Morris Ave
- 652 W Morris Ave
- 640 W Celeste Ave
- 694 W Morris Ave
- 707 W Morris Ave
- 625 W Morris Ave
- 638 W Morris Ave
- 622 W Celeste Ave
- 708 W Celeste Ave
- 659 W Celeste Ave
- 673 W Celeste Ave
- 665 W Bullard Ave
- 624 W Morris Ave