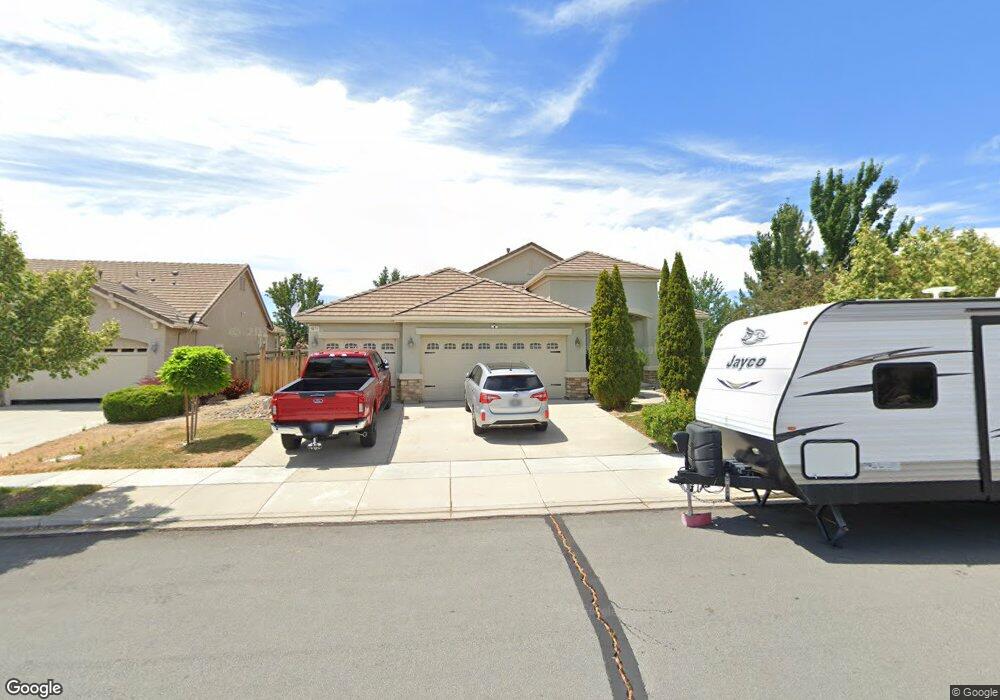
6671 Fabric Dr Sparks, NV 89436
Wingfield Springs NeighborhoodEstimated Value: $626,100 - $690,000
3
Beds
2
Baths
2,169
Sq Ft
$303/Sq Ft
Est. Value
About This Home
This home is located at 6671 Fabric Dr, Sparks, NV 89436 and is currently estimated at $656,775, approximately $302 per square foot. 6671 Fabric Dr is a home located in Washoe County with nearby schools including Spanish Springs Elementary School, Yvonne Shaw Middle School, and Spanish Springs High School.
Ownership History
Date
Name
Owned For
Owner Type
Purchase Details
Closed on
May 13, 2011
Sold by
Guzelis Christine L
Bought by
Linton Jeffrey D and Linton Kimberlee A
Current Estimated Value
Home Financials for this Owner
Home Financials are based on the most recent Mortgage that was taken out on this home.
Original Mortgage
$230,400
Outstanding Balance
$158,858
Interest Rate
4.71%
Mortgage Type
VA
Estimated Equity
$497,917
Purchase Details
Closed on
Mar 18, 2009
Sold by
Guzelis Christine L
Bought by
Guzelis Christine L and Christine Guzelis Trust
Purchase Details
Closed on
Apr 24, 2008
Sold by
Guzelis Gary
Bought by
Guzelis Christy
Purchase Details
Closed on
Apr 23, 2008
Sold by
Nevada State Bank
Bought by
Guzelis Christy
Purchase Details
Closed on
Feb 19, 2008
Sold by
R & K Homes Tucker Ranch Llc
Bought by
Nevada State Bank
Create a Home Valuation Report for This Property
The Home Valuation Report is an in-depth analysis detailing your home's value as well as a comparison with similar homes in the area
Home Values in the Area
Average Home Value in this Area
Purchase History
| Date | Buyer | Sale Price | Title Company |
|---|---|---|---|
| Linton Jeffrey D | $225,000 | First American Title Reno | |
| Guzelis Christine L | -- | None Available | |
| Guzelis Christy | -- | First Centennial Reno | |
| Guzelis Christy | $320,000 | First Centennial Reno | |
| Nevada State Bank | $10,303,457 | Western Title Inc Ridge |
Source: Public Records
Mortgage History
| Date | Status | Borrower | Loan Amount |
|---|---|---|---|
| Open | Linton Jeffrey D | $230,400 |
Source: Public Records
Tax History Compared to Growth
Tax History
| Year | Tax Paid | Tax Assessment Tax Assessment Total Assessment is a certain percentage of the fair market value that is determined by local assessors to be the total taxable value of land and additions on the property. | Land | Improvement |
|---|---|---|---|---|
| 2025 | $4,111 | $163,772 | $43,925 | $119,847 |
| 2024 | $3,809 | $158,574 | $37,940 | $120,634 |
| 2023 | $3,809 | $157,241 | $43,295 | $113,946 |
| 2022 | $3,529 | $130,271 | $35,490 | $94,781 |
| 2021 | $3,161 | $122,449 | $28,350 | $94,099 |
| 2020 | $3,074 | $121,960 | $27,860 | $94,100 |
| 2019 | $2,928 | $118,319 | $27,615 | $90,704 |
| 2018 | $2,794 | $109,255 | $20,545 | $88,710 |
| 2017 | $2,681 | $107,679 | $18,935 | $88,744 |
| 2016 | $2,613 | $103,100 | $17,185 | $85,915 |
| 2015 | $2,608 | $96,430 | $17,150 | $79,280 |
| 2014 | $2,527 | $79,358 | $13,265 | $66,093 |
| 2013 | -- | $67,646 | $10,780 | $56,866 |
Source: Public Records
Map
Nearby Homes
- 6756 Fabric Dr
- 6581 Voyage Dr
- 4033 Antinori Dr
- 6607 Panther Creek Dr
- 6480 Citori Dr
- 6636 N Latour
- 4147 Matter Dr
- 3890 Dominus Dr
- 3850 Artadi Dr
- 7076 Sacred Cir
- 3723 Ancestor Cir
- 7023 Cinder Village Dr
- 3684 Ancestor Cir
- 3717 Perseus Dr
- 3706 Lepus Dr
- 3660 Virgo Ct
- 7422 Windswept Loop
- 6570 Rey Del Sierra Ct
- 3727 Caymus Dr
- 3706 Deutz Dr
- 6679 Fabric Dr
- 6659 Fabric Dr
- 6687 Fabric Dr
- 6672 Fabric Dr
- 6652 Fabric Dr
- 6680 Fabric Dr
- 6682 Magical Dr
- 6694 Magical Dr
- 6672 Magical Dr
- 6637 Fabric Dr
- 6697 Fabric Dr
- 6658 Magical Dr
- 6706 Magical Dr
- 6638 Fabric Dr
- 6690 Fabric Dr
- 6716 Magical Dr
- 6659 Equation Dr
- 6671 Equation Dr
- 6705 Fabric Dr
- 6700 Fabric Dr