6674 Fridley St NE Minneapolis, MN 55432
Estimated Value: $369,000 - $411,000
3
Beds
2
Baths
2,560
Sq Ft
$153/Sq Ft
Est. Value
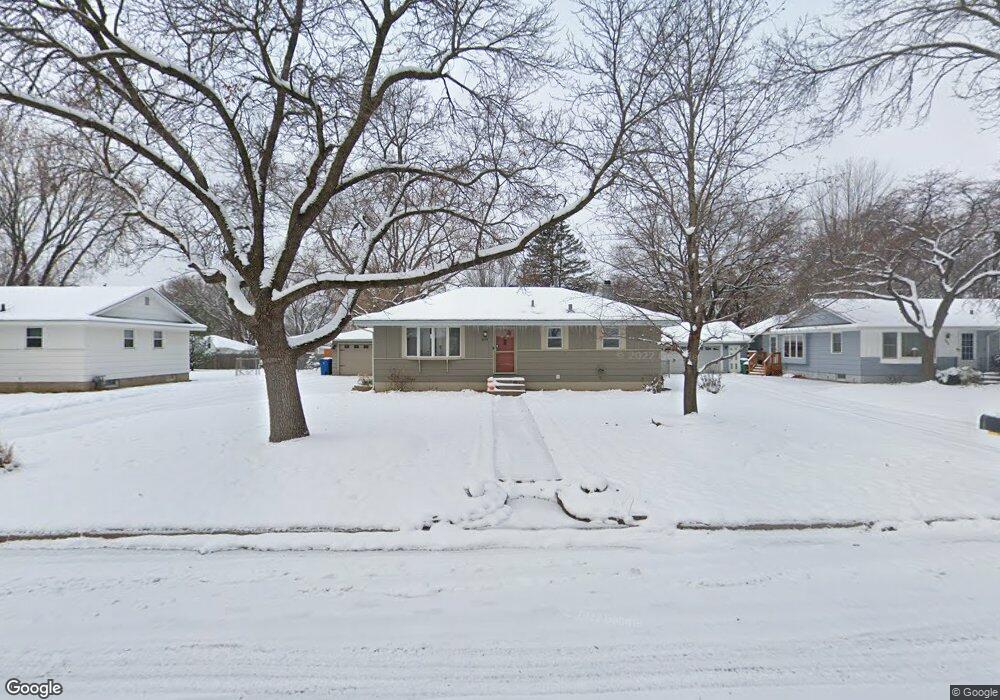
About This Home
This home is located at 6674 Fridley St NE, Minneapolis, MN 55432 and is currently estimated at $392,691, approximately $153 per square foot. 6674 Fridley St NE is a home located in Anoka County with nearby schools including Hayes Elementary School, Fridley Middle School, and Fridley Senior High School.
Ownership History
Date
Name
Owned For
Owner Type
Purchase Details
Closed on
Apr 18, 2022
Sold by
Sell Curtis and Sell Sara
Bought by
Leill Stephanie and Norton Nicholas
Current Estimated Value
Home Financials for this Owner
Home Financials are based on the most recent Mortgage that was taken out on this home.
Original Mortgage
$388,000
Outstanding Balance
$362,521
Interest Rate
3.76%
Mortgage Type
New Conventional
Estimated Equity
$30,170
Purchase Details
Closed on
Jun 26, 2015
Sold by
Johnson Robb Robb
Bought by
Sell Curtis Curtis
Home Financials for this Owner
Home Financials are based on the most recent Mortgage that was taken out on this home.
Original Mortgage
$185,000
Interest Rate
4.02%
Purchase Details
Closed on
Oct 25, 1999
Sold by
Austad Kevin and Austad Georgeann
Bought by
Ingbretson Brian and Ingbretson Heather
Create a Home Valuation Report for This Property
The Home Valuation Report is an in-depth analysis detailing your home's value as well as a comparison with similar homes in the area
Home Values in the Area
Average Home Value in this Area
Purchase History
| Date | Buyer | Sale Price | Title Company |
|---|---|---|---|
| Leill Stephanie | $400,000 | -- | |
| Sell Curtis Curtis | $206,500 | -- | |
| Ingbretson Brian | $150,000 | -- |
Source: Public Records
Mortgage History
| Date | Status | Borrower | Loan Amount |
|---|---|---|---|
| Open | Leill Stephanie | $388,000 | |
| Previous Owner | Sell Curtis Curtis | $185,000 |
Source: Public Records
Tax History Compared to Growth
Tax History
| Year | Tax Paid | Tax Assessment Tax Assessment Total Assessment is a certain percentage of the fair market value that is determined by local assessors to be the total taxable value of land and additions on the property. | Land | Improvement |
|---|---|---|---|---|
| 2025 | $4,853 | $365,900 | $93,500 | $272,400 |
| 2024 | $4,853 | $354,900 | $86,400 | $268,500 |
| 2023 | $4,478 | $357,300 | $86,400 | $270,900 |
| 2022 | $4,146 | $360,700 | $75,600 | $285,100 |
| 2021 | $3,954 | $291,900 | $67,600 | $224,300 |
| 2020 | $3,710 | $277,800 | $67,700 | $210,100 |
| 2019 | $3,514 | $249,000 | $54,600 | $194,400 |
| 2018 | $3,202 | $240,800 | $0 | $0 |
| 2017 | $2,972 | $214,500 | $0 | $0 |
| 2016 | $2,673 | $178,800 | $0 | $0 |
| 2015 | $2,584 | $178,800 | $50,900 | $127,900 |
| 2014 | -- | $157,000 | $43,900 | $113,100 |
Source: Public Records
Map
Nearby Homes
- 6611 Mckinley St NE
- 1503 S Timber Ridge
- 2345 Stinson Blvd
- 2247 Walnut Ct S
- 1340 69th Ave NE
- 6550 Central Ave NE
- 7625 Pleasant View Dr
- 3075 21st Ln NW
- 6310 Squire Dr NE
- 6803 Channel Rd NE
- 6677 Lucia Ln NE
- 6250 Stinson Blvd NE
- 1589 Briardale Rd NE
- 1579 Briardale Rd NE
- 6200 Rice Creek Dr NE
- 2005 28th Ave NW Unit 102
- 2542 Silver Lake Rd NW
- 6175 Briardale Ct NE
- 6840 Brookview Dr NE
- 3001 Woodale Dr
- 6684 Fridley St NE
- 6654 Fridley St NE
- 6694 Fridley St NE
- 6683 Anoka St NE
- 6675 Anoka St NE
- 6646 Fridley St NE
- 6675 Fridley St NE
- 6655 Anoka St NE
- 6685 Fridley St NE
- 6689 Anoka St NE
- 6645 Fridley St NE
- 6632 Fridley St NE
- 6645 Anoka St NE
- 1601 66 1 2 Ave NE
- 6631 Fridley St NE
- 1601 66 1/2 Ave NE
- 6627 Anoka St NE
- 6616 Fridley St NE
- 6660 Anoka St NE
- 6670 Anoka St NE