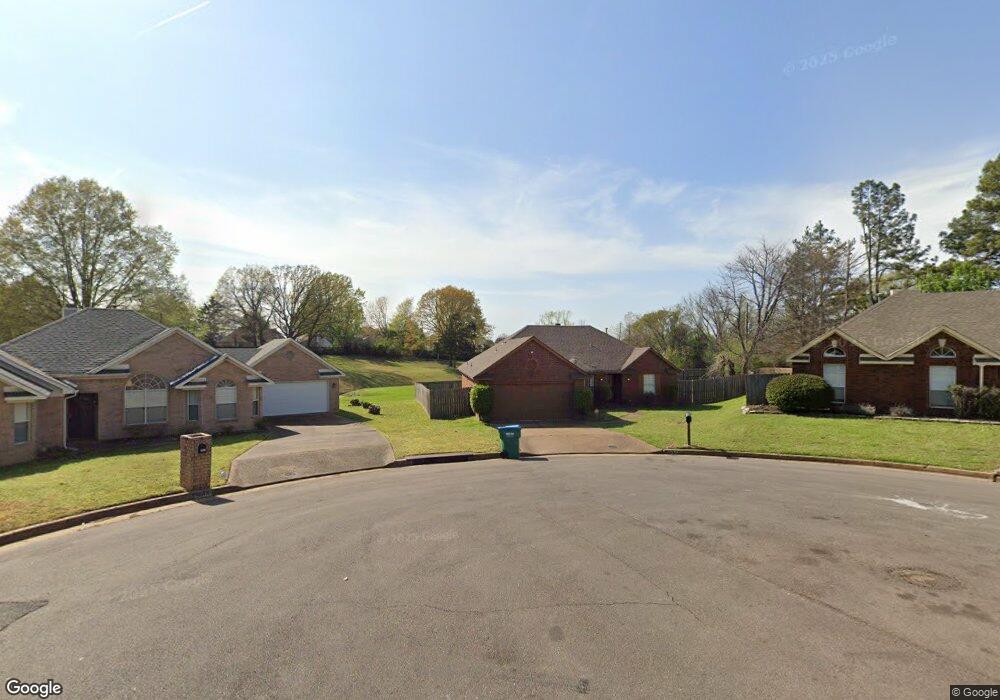
6676 Plumblee Cove W Memphis, TN 38141
Parkway Village NeighborhoodEstimated Value: $216,073 - $239,000
3
Beds
2
Baths
1,644
Sq Ft
$138/Sq Ft
Est. Value
About This Home
This home is located at 6676 Plumblee Cove W, Memphis, TN 38141 and is currently estimated at $227,268, approximately $138 per square foot. 6676 Plumblee Cove W is a home located in Shelby County with nearby schools including Highland Oaks Elementary School, Highland Oaks Middle School, and Southwind High School.
Ownership History
Date
Name
Owned For
Owner Type
Purchase Details
Closed on
May 14, 2020
Sold by
Worden Ross Clayton
Bought by
Divergent Realty Llc
Current Estimated Value
Purchase Details
Closed on
Jun 19, 2019
Sold by
I2l Llc
Bought by
Worden Ross Clayton
Home Financials for this Owner
Home Financials are based on the most recent Mortgage that was taken out on this home.
Original Mortgage
$119,920
Interest Rate
4%
Mortgage Type
New Conventional
Purchase Details
Closed on
Mar 13, 2019
Sold by
Sizemore Michael T and Sizemore Trina S
Bought by
I2l Llc
Purchase Details
Closed on
May 8, 1997
Sold by
Va
Bought by
Sizemore Michael T and Sizemore Trina S
Home Financials for this Owner
Home Financials are based on the most recent Mortgage that was taken out on this home.
Original Mortgage
$98,000
Interest Rate
7.75%
Mortgage Type
Seller Take Back
Create a Home Valuation Report for This Property
The Home Valuation Report is an in-depth analysis detailing your home's value as well as a comparison with similar homes in the area
Home Values in the Area
Average Home Value in this Area
Purchase History
| Date | Buyer | Sale Price | Title Company |
|---|---|---|---|
| Divergent Realty Llc | -- | None Available | |
| Worden Ross Clayton | $149,900 | Close Trak Closing & Ttl Svc | |
| I2l Llc | $88,901 | None Available | |
| Sizemore Michael T | $98,500 | -- |
Source: Public Records
Mortgage History
| Date | Status | Borrower | Loan Amount |
|---|---|---|---|
| Previous Owner | Worden Ross Clayton | $119,920 | |
| Previous Owner | Sizemore Michael T | $98,000 |
Source: Public Records
Tax History Compared to Growth
Tax History
| Year | Tax Paid | Tax Assessment Tax Assessment Total Assessment is a certain percentage of the fair market value that is determined by local assessors to be the total taxable value of land and additions on the property. | Land | Improvement |
|---|---|---|---|---|
| 2025 | $1,407 | $56,100 | $11,925 | $44,175 |
| 2024 | $1,407 | $41,500 | $6,825 | $34,675 |
| 2023 | $1,407 | $41,500 | $6,825 | $34,675 |
| 2022 | $1,407 | $41,500 | $6,825 | $34,675 |
| 2021 | $1,432 | $41,500 | $6,825 | $34,675 |
| 2020 | $1,233 | $30,450 | $6,825 | $23,625 |
| 2019 | $1,233 | $30,450 | $6,825 | $23,625 |
| 2018 | $1,233 | $30,450 | $6,825 | $23,625 |
| 2017 | $1,252 | $30,450 | $6,825 | $23,625 |
| 2016 | $1,125 | $25,750 | $0 | $0 |
| 2014 | $1,125 | $25,750 | $0 | $0 |
Source: Public Records
Map
Nearby Homes
- 5265 Crystal Oak Dr
- 6696 Autumn Wood Cove
- 5340 Shady Ridge Cove
- 6744 Shoreline Cir
- 6716 Shoreline Cir
- 6770 Shoreline Cir
- 5389 Chinkapin Oak Cove
- 6941 Bennington Cir
- 4868 Water Fowl Ln
- 4935 Woodberry Cove
- 5178 Autumn Morning Cove
- 4821 Blue Wing St
- 9082 Fox Cove
- 5084 Autumn Morning Ln
- 6732 Henredon Dr
- 7129 Brook Mill Cove
- 7125 Farmhouse Dr
- 8140 Hunters Hill Cove
- 6788 Burlingame Dr
- 5100 Sunny Autumn Ln
- 6682 Plumblee Cove W
- 6675 Plumblee Cove W
- 6688 Plumblee Cove W
- 6681 Stewart Forest Cove W
- 6681 Plumblee Cove W
- 6675 Stewart Forest Cove W
- 6689 Plumblee Cove W
- 6687 Stewart Forest Cove W
- 6698 Plumblee Cove W
- 5299 Ross Rd
- 6699 Plumblee Cove W
- 6654 Walter Forest Cove
- 6674 Stewart Forest Cove W
- 5289 Ross Rd
- 5329 Ross Rd
- 6652 Walter Forest Cove
- 5320 Sleepy Oak Cove
- 5324 Sleepy Oak Cove
- 6662 Walter Forest Cove
- 6680 Stewart Forest Cove W