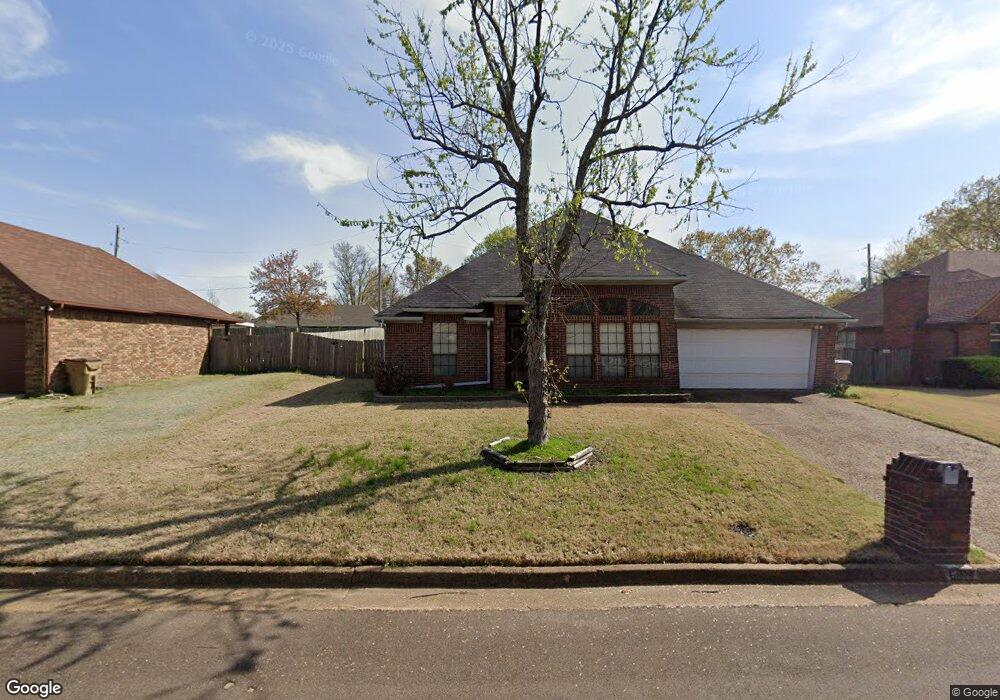
6679 Spencer Forest Cove W Memphis, TN 38141
Parkway Village NeighborhoodEstimated Value: $219,000 - $237,000
3
Beds
2
Baths
1,663
Sq Ft
$138/Sq Ft
Est. Value
About This Home
This home is located at 6679 Spencer Forest Cove W, Memphis, TN 38141 and is currently estimated at $229,033, approximately $137 per square foot. 6679 Spencer Forest Cove W is a home located in Shelby County with nearby schools including Highland Oaks Elementary School, Highland Oaks Middle School, and Southwind High School.
Ownership History
Date
Name
Owned For
Owner Type
Purchase Details
Closed on
Sep 29, 2006
Sold by
Newsom Deadrick and Newsom Marilyn
Bought by
Wiseman Stephen J
Current Estimated Value
Home Financials for this Owner
Home Financials are based on the most recent Mortgage that was taken out on this home.
Original Mortgage
$108,000
Outstanding Balance
$72,408
Interest Rate
8.82%
Mortgage Type
Purchase Money Mortgage
Estimated Equity
$156,625
Purchase Details
Closed on
Jan 2, 2003
Sold by
Benson Marilyn
Bought by
Benson Marilyn and Newsom Deadrick
Home Financials for this Owner
Home Financials are based on the most recent Mortgage that was taken out on this home.
Original Mortgage
$105,300
Interest Rate
9.5%
Purchase Details
Closed on
Nov 22, 2002
Sold by
Worthington Penny
Bought by
Benson Marilyn
Home Financials for this Owner
Home Financials are based on the most recent Mortgage that was taken out on this home.
Original Mortgage
$105,300
Interest Rate
9.5%
Create a Home Valuation Report for This Property
The Home Valuation Report is an in-depth analysis detailing your home's value as well as a comparison with similar homes in the area
Home Values in the Area
Average Home Value in this Area
Purchase History
| Date | Buyer | Sale Price | Title Company |
|---|---|---|---|
| Wiseman Stephen J | $135,000 | None Available | |
| Benson Marilyn | -- | -- | |
| Benson Marilyn | $115,000 | Equity Title & Escrow Co |
Source: Public Records
Mortgage History
| Date | Status | Borrower | Loan Amount |
|---|---|---|---|
| Open | Wiseman Stephen J | $108,000 | |
| Previous Owner | Benson Marilyn | $105,300 | |
| Closed | Benson Marilyn | $11,700 |
Source: Public Records
Tax History Compared to Growth
Tax History
| Year | Tax Paid | Tax Assessment Tax Assessment Total Assessment is a certain percentage of the fair market value that is determined by local assessors to be the total taxable value of land and additions on the property. | Land | Improvement |
|---|---|---|---|---|
| 2025 | $1,540 | $60,500 | $11,950 | $48,550 |
| 2024 | $1,540 | $45,425 | $6,825 | $38,600 |
| 2023 | $1,540 | $45,425 | $6,825 | $38,600 |
| 2022 | $1,540 | $45,425 | $6,825 | $38,600 |
| 2021 | $1,567 | $45,425 | $6,825 | $38,600 |
| 2020 | $1,338 | $33,025 | $6,825 | $26,200 |
| 2019 | $1,338 | $33,025 | $6,825 | $26,200 |
| 2018 | $1,338 | $33,025 | $6,825 | $26,200 |
| 2017 | $1,357 | $33,025 | $6,825 | $26,200 |
| 2016 | $1,158 | $26,500 | $0 | $0 |
| 2014 | $1,158 | $26,500 | $0 | $0 |
Source: Public Records
Map
Nearby Homes
- 5265 Crystal Oak Dr
- 6716 Shoreline Cir
- 6744 Shoreline Cir
- 6770 Shoreline Cir
- 5340 Shady Ridge Cove
- 6696 Autumn Wood Cove
- 5389 Chinkapin Oak Cove
- 6941 Bennington Cir
- 4868 Water Fowl Ln
- 4935 Woodberry Cove
- 4821 Blue Wing St
- 5178 Autumn Morning Cove
- 6732 Henredon Dr
- 5084 Autumn Morning Ln
- 6788 Burlingame Dr
- 7125 Farmhouse Dr
- 9082 Fox Cove
- 5100 Sunny Autumn Ln
- 7129 Brook Mill Cove
- 8140 Hunters Hill Cove
- 6671 Spencer Forest Cove W
- 6687 Spencer Forest Cove W
- 6680 Stewart Forest Cove W
- 6663 Spencer Forest Cove W
- 6663 Spencer Forest Cove W
- 6688 Stewart Forest Cove W
- 6678 Spencer Forest Cove W
- 5259 Ross Rd
- 6670 Spencer Forest Cove W
- 6674 Stewart Forest Cove W
- 6688 Spencer Forest Cove W
- 5269 Ross Rd
- 6662 Spencer Forest Cove W
- 5245 Ross Rd
- 5277 Ross Rd
- 6655 Spencer Forest Cove W
- 6675 Stewart Forest Cove W
- 6656 Spencer Forest Cove W
- 6687 Stewart Forest Cove W
- 6681 Stewart Forest Cove W