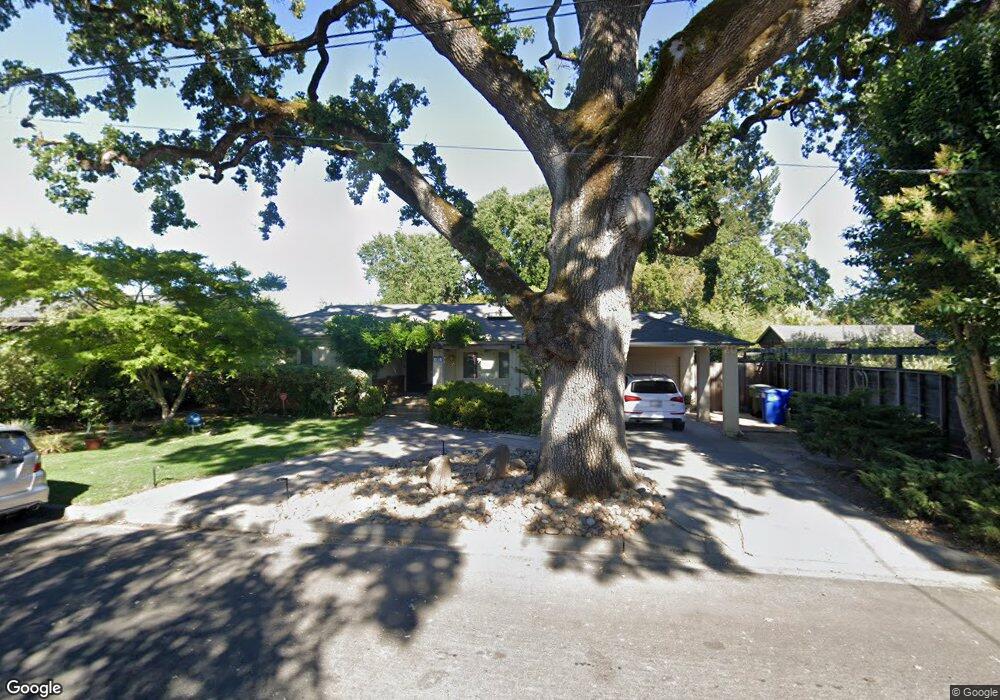
668 Austin Ave Sonoma, CA 95476
Estimated Value: $1,764,109 - $2,459,000
2
Beds
2
Baths
1,878
Sq Ft
$1,072/Sq Ft
Est. Value
About This Home
This home is located at 668 Austin Ave, Sonoma, CA 95476 and is currently estimated at $2,013,027, approximately $1,071 per square foot. 668 Austin Ave is a home located in Sonoma County with nearby schools including Prestwood Elementary School, Adele Harrison Middle School, and Creekside High School.
Ownership History
Date
Name
Owned For
Owner Type
Purchase Details
Closed on
Jul 17, 2008
Sold by
Merlo Richard P and Merlo Diane L
Bought by
Merlo Richard Paul and Merlo Diane Louise
Current Estimated Value
Home Financials for this Owner
Home Financials are based on the most recent Mortgage that was taken out on this home.
Original Mortgage
$934,500
Outstanding Balance
$604,400
Interest Rate
6.12%
Mortgage Type
New Conventional
Estimated Equity
$1,408,627
Purchase Details
Closed on
Jun 17, 2008
Sold by
Katz Steven Howard
Bought by
Merlo Richard P and Merlo Diane L
Home Financials for this Owner
Home Financials are based on the most recent Mortgage that was taken out on this home.
Original Mortgage
$934,500
Outstanding Balance
$604,400
Interest Rate
6.12%
Mortgage Type
New Conventional
Estimated Equity
$1,408,627
Purchase Details
Closed on
Aug 16, 2006
Sold by
Katz Steven Howard and Katz Adrienne P
Bought by
Katz Steven H and The Steven H & Adrienne P Katz
Create a Home Valuation Report for This Property
The Home Valuation Report is an in-depth analysis detailing your home's value as well as a comparison with similar homes in the area
Home Values in the Area
Average Home Value in this Area
Purchase History
| Date | Buyer | Sale Price | Title Company |
|---|---|---|---|
| Merlo Richard Paul | -- | Financial Title Company | |
| Merlo Richard P | $1,410,000 | Financial Title Company | |
| Katz Steven H | -- | None Available |
Source: Public Records
Mortgage History
| Date | Status | Borrower | Loan Amount |
|---|---|---|---|
| Open | Merlo Richard Paul | $934,500 |
Source: Public Records
Tax History
| Year | Tax Paid | Tax Assessment Tax Assessment Total Assessment is a certain percentage of the fair market value that is determined by local assessors to be the total taxable value of land and additions on the property. | Land | Improvement |
|---|---|---|---|---|
| 2025 | $20,650 | $1,753,535 | $1,228,137 | $525,398 |
| 2024 | $20,650 | $1,719,153 | $1,204,056 | $515,097 |
| 2023 | $20,650 | $1,685,446 | $1,180,448 | $504,998 |
| 2022 | $20,936 | $1,652,399 | $1,157,302 | $495,097 |
| 2021 | $20,107 | $1,620,000 | $1,134,610 | $485,390 |
| 2020 | $10,193 | $1,603,389 | $1,122,976 | $480,413 |
| 2019 | $19,108 | $1,571,951 | $1,100,957 | $470,994 |
| 2018 | $18,926 | $1,541,129 | $1,079,370 | $461,759 |
| 2017 | $18,732 | $1,510,911 | $1,058,206 | $452,705 |
| 2016 | $17,762 | $1,481,286 | $1,037,457 | $443,829 |
| 2015 | $17,194 | $1,459,037 | $1,021,874 | $437,163 |
| 2014 | $16,406 | $1,392,000 | $975,000 | $417,000 |
Source: Public Records
Map
Nearby Homes
Your Personal Tour Guide
Ask me questions while you tour the home.