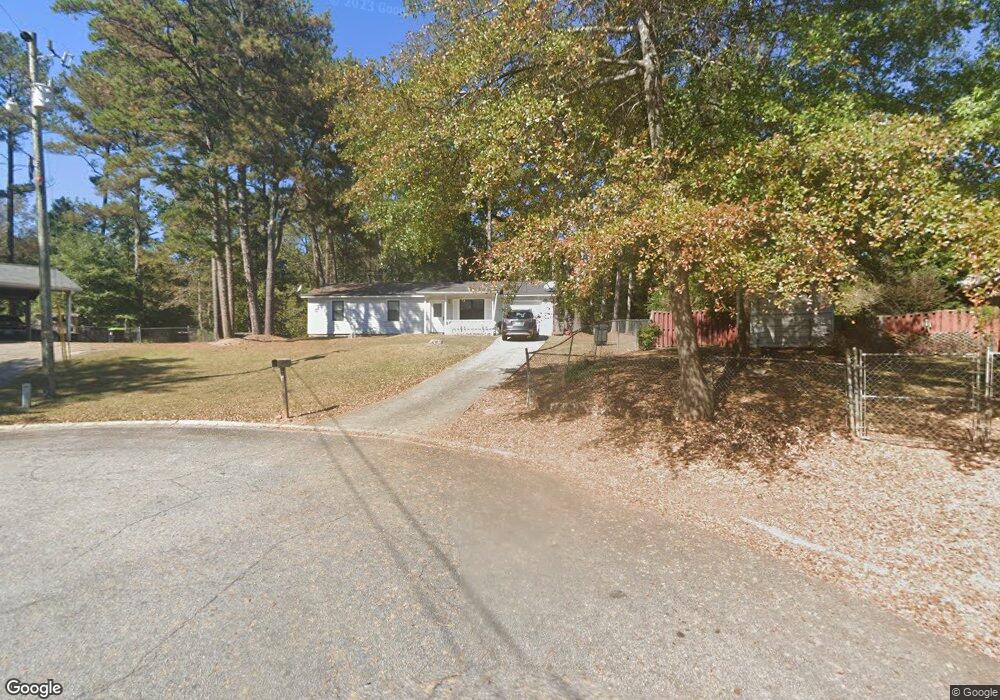
668 Huron Ct SE Unit 2 Conyers, GA 30094
Estimated Value: $189,019 - $218,000
3
Beds
2
Baths
960
Sq Ft
$217/Sq Ft
Est. Value
About This Home
This home is located at 668 Huron Ct SE Unit 2, Conyers, GA 30094 and is currently estimated at $208,255, approximately $216 per square foot. 668 Huron Ct SE Unit 2 is a home located in Rockdale County with nearby schools including Honey Creek Elementary School, Edwards Middle School, and Heritage High School.
Ownership History
Date
Name
Owned For
Owner Type
Purchase Details
Closed on
Dec 6, 2005
Sold by
Clark Rodney T
Bought by
Njie Ali E and Njie Janawa
Current Estimated Value
Home Financials for this Owner
Home Financials are based on the most recent Mortgage that was taken out on this home.
Original Mortgage
$97,500
Outstanding Balance
$61,485
Interest Rate
8.63%
Mortgage Type
New Conventional
Estimated Equity
$146,770
Purchase Details
Closed on
Mar 31, 2000
Sold by
Hernandez Aaron
Bought by
Clark Rodney T
Home Financials for this Owner
Home Financials are based on the most recent Mortgage that was taken out on this home.
Original Mortgage
$82,400
Interest Rate
8.27%
Mortgage Type
New Conventional
Purchase Details
Closed on
Sep 4, 1998
Sold by
Jordan Jill M
Bought by
Mernandez Aaron
Home Financials for this Owner
Home Financials are based on the most recent Mortgage that was taken out on this home.
Original Mortgage
$70,963
Interest Rate
6.96%
Mortgage Type
New Conventional
Create a Home Valuation Report for This Property
The Home Valuation Report is an in-depth analysis detailing your home's value as well as a comparison with similar homes in the area
Home Values in the Area
Average Home Value in this Area
Purchase History
| Date | Buyer | Sale Price | Title Company |
|---|---|---|---|
| Njie Ali E | $97,500 | -- | |
| Clark Rodney T | $82,400 | -- | |
| Mernandez Aaron | $71,000 | -- |
Source: Public Records
Mortgage History
| Date | Status | Borrower | Loan Amount |
|---|---|---|---|
| Open | Njie Ali E | $97,500 | |
| Previous Owner | Clark Rodney T | $82,400 | |
| Previous Owner | Mernandez Aaron | $70,963 |
Source: Public Records
Tax History Compared to Growth
Tax History
| Year | Tax Paid | Tax Assessment Tax Assessment Total Assessment is a certain percentage of the fair market value that is determined by local assessors to be the total taxable value of land and additions on the property. | Land | Improvement |
|---|---|---|---|---|
| 2024 | $1,634 | $72,200 | $19,080 | $53,120 |
| 2023 | $1,324 | $62,120 | $15,200 | $46,920 |
| 2022 | $1,060 | $51,840 | $15,080 | $36,760 |
| 2021 | $757 | $38,640 | $8,000 | $30,640 |
| 2020 | $554 | $33,480 | $8,000 | $25,480 |
| 2019 | $437 | $29,200 | $7,200 | $22,000 |
| 2018 | $145 | $19,680 | $4,680 | $15,000 |
| 2017 | $93 | $17,960 | $4,680 | $13,280 |
| 2016 | $86 | $17,960 | $4,680 | $13,280 |
| 2015 | $143 | $19,920 | $4,680 | $15,240 |
| 2014 | $149 | $20,560 | $3,960 | $16,600 |
| 2013 | -- | $26,920 | $8,760 | $18,160 |
Source: Public Records
Map
Nearby Homes
- 665 Huron Ct SE
- 693 Deering Rd SE
- 2987 Landmark Dr SE
- 3021 Lakeridge Dr SE
- 3027 Lakeridge Dr SE
- 726 Shoreline Trail SE
- 3014 Lakeridge Dr SE
- 549 Greenview Ave SE
- 2923 Raintree Dr SE
- 2924 Raintree Dr SE
- 574 Almand Branch Rd SE Unit 1
- 812 Raintree Way SE
- 2910 Stanton Rd SE
- 820 Bridgewater Way SE
- 1813 Holmsey Cir
- 2717 Stanton Woods Dr SE
- 2851 Stanton Rd SE
- 917 Curry Cir SE
- 3165 Goode Rd
- 1920 Logan Ln
- 2939 Landmark Dr SE
- 664 Huron Ct SE
- 2927 Landmark Dr SE
- 659 Lakeridge Dr SE
- 665 Lakeridge Dr SE
- 653 Lakeridge Dr SE
- 653 Lakeridge Dr SE
- 675 Lakeridge Dr SE
- 647 Lakeridge Dr SE
- 647 Lakeridge Dr SE Unit 2
- 2957 Landmark Dr SE Unit 2
- 2930 Landmark Dr SE
- 635 Lakeridge Cir SE
- 2940 Landmark Dr SE
- 631 Lakeridge Cir SE
- 2920 Landmark Dr SE
- 639 Lakeridge Cir SE
- 2950 Landmark Dr SE
- 627 Lakeridge Cir SE
- 656 Lakeridge Dr SE