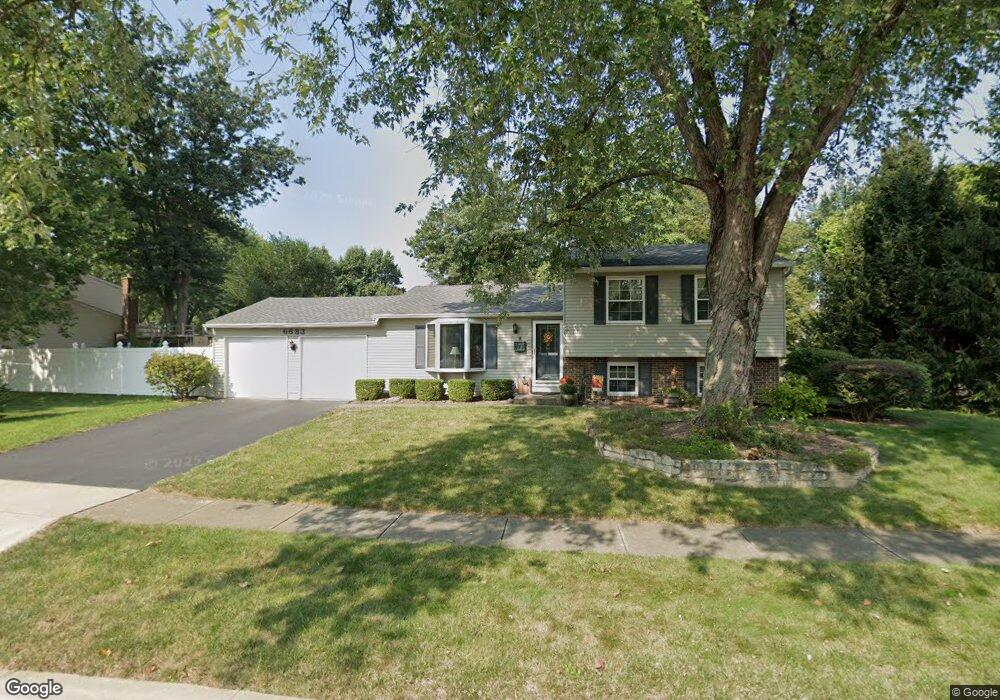
6683 Skywae Dr Columbus, OH 43229
Northgate NeighborhoodEstimated Value: $265,138 - $309,000
3
Beds
2
Baths
1,420
Sq Ft
$203/Sq Ft
Est. Value
About This Home
This home is located at 6683 Skywae Dr, Columbus, OH 43229 and is currently estimated at $288,535, approximately $203 per square foot. 6683 Skywae Dr is a home located in Franklin County with nearby schools including Northgate Intermediate, Alpine Elementary School, and Woodward Park Middle School.
Ownership History
Date
Name
Owned For
Owner Type
Purchase Details
Closed on
Apr 13, 2001
Sold by
Hagerman James B and Hagerman Lori L
Bought by
Ratcliff John W and Ratcliff Deborah S
Current Estimated Value
Home Financials for this Owner
Home Financials are based on the most recent Mortgage that was taken out on this home.
Original Mortgage
$117,638
Outstanding Balance
$41,319
Interest Rate
7.05%
Mortgage Type
FHA
Estimated Equity
$247,216
Purchase Details
Closed on
Oct 31, 1994
Sold by
Rumm Richard K
Bought by
Hagerman James Brien and Hagerman Lori Louise
Home Financials for this Owner
Home Financials are based on the most recent Mortgage that was taken out on this home.
Original Mortgage
$51,900
Interest Rate
8.68%
Mortgage Type
New Conventional
Purchase Details
Closed on
Apr 4, 1990
Purchase Details
Closed on
Apr 19, 1988
Create a Home Valuation Report for This Property
The Home Valuation Report is an in-depth analysis detailing your home's value as well as a comparison with similar homes in the area
Home Values in the Area
Average Home Value in this Area
Purchase History
| Date | Buyer | Sale Price | Title Company |
|---|---|---|---|
| Ratcliff John W | $121,000 | -- | |
| Hagerman James Brien | $91,900 | -- | |
| -- | $31,000 | -- | |
| -- | $72,900 | -- |
Source: Public Records
Mortgage History
| Date | Status | Borrower | Loan Amount |
|---|---|---|---|
| Open | Ratcliff John W | $117,638 | |
| Closed | Hagerman James Brien | $51,900 |
Source: Public Records
Tax History
| Year | Tax Paid | Tax Assessment Tax Assessment Total Assessment is a certain percentage of the fair market value that is determined by local assessors to be the total taxable value of land and additions on the property. | Land | Improvement |
|---|---|---|---|---|
| 2025 | $3,649 | $81,310 | $22,750 | $58,560 |
| 2024 | $3,649 | $81,310 | $22,750 | $58,560 |
| 2023 | $3,603 | $81,305 | $22,750 | $58,555 |
| 2022 | $2,567 | $49,490 | $12,040 | $37,450 |
| 2021 | $2,571 | $49,490 | $12,040 | $37,450 |
| 2020 | $2,575 | $49,490 | $12,040 | $37,450 |
| 2019 | $2,397 | $39,520 | $9,630 | $29,890 |
| 2018 | $2,403 | $39,520 | $9,630 | $29,890 |
| 2017 | $2,396 | $39,520 | $9,630 | $29,890 |
| 2016 | $2,660 | $40,150 | $9,800 | $30,350 |
| 2015 | $2,414 | $40,150 | $9,800 | $30,350 |
| 2014 | $2,420 | $40,150 | $9,800 | $30,350 |
| 2013 | $1,194 | $40,145 | $9,800 | $30,345 |
Source: Public Records
Map
Nearby Homes
- 1755 Hillandale Ave
- 1635 Tendril Ct
- 1946 Rockdale Dr Unit 57
- 6425 Deer Ridge Ln
- 6416 Faircrest Rd
- 1421 Bosworth Place
- 1322 Bolenhill Ct
- 1852 Balsamridge Rd
- 6245 Sharon Woods Blvd
- 6336 Archmere Square E
- 6348 Birkewood St
- 2125 Keltonshire Ave
- 6166 Harrington Ct
- 2154-2156 Jewett Dr
- 6148 Sharon Woods Blvd
- 6233 Karl Rd
- 1281 Home Acre Dr
- 2197 Bayfield Dr
- 6019 Beechcroft Rd
- 6035 Karl Rd
- 1715 Americana Ct
- 6673 Skywae Dr
- 1705 Americana Ct
- 6667 Skywae Dr
- 6707 Skywae Dr
- 1750 Justice Ave
- 6660 Skywae Dr
- 1720 Americana Ct
- 6690 Skywae Dr
- 1710 Americana Ct
- 1697 Americana Ct
- 6700 Skywae Dr
- 6661 Skywae Dr
- 1700 Americana Ct
- 1747 Justice Ave
- 6710 Skywae Dr
- 6646 Merry Ln
- 1691 Americana Ct
- 6655 Skywae Dr
- 1690 Americana Ct
Your Personal Tour Guide
Ask me questions while you tour the home.