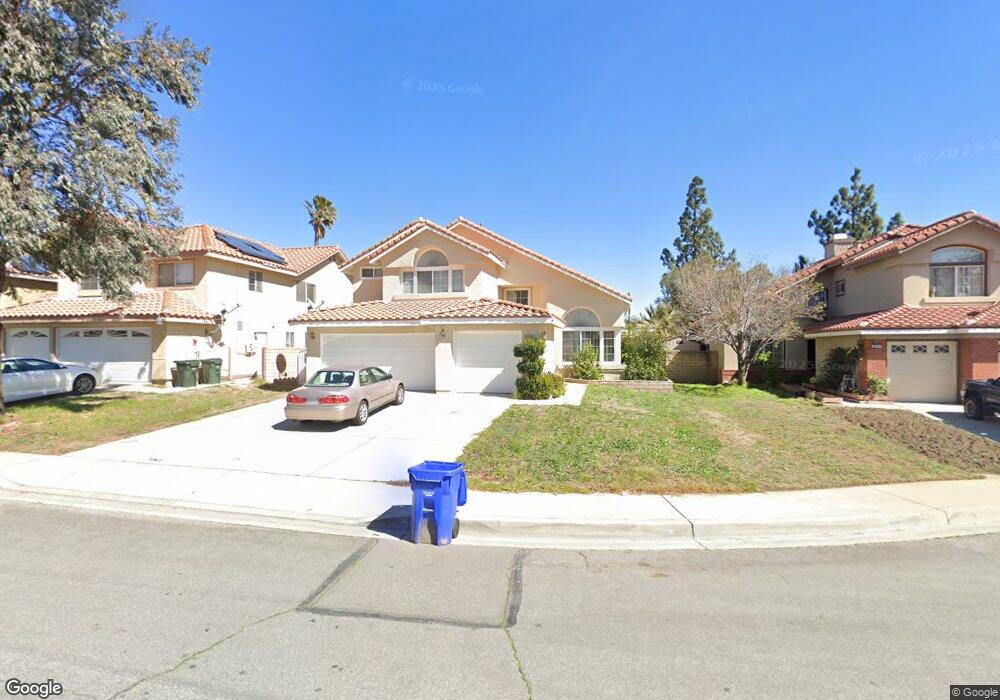
6685 Kaiser Ave Fontana, CA 92336
Estimated Value: $691,380 - $742,000
4
Beds
3
Baths
2,328
Sq Ft
$308/Sq Ft
Est. Value
About This Home
This home is located at 6685 Kaiser Ave, Fontana, CA 92336 and is currently estimated at $716,845, approximately $307 per square foot. 6685 Kaiser Ave is a home located in San Bernardino County with nearby schools including Nancy R. Kordyak Elementary School, Ethel Kucera Middle School, and Wilmer Amina Carter High School.
Ownership History
Date
Name
Owned For
Owner Type
Purchase Details
Closed on
Jun 21, 1999
Sold by
Federal National Mortgage Association
Bought by
Kyle Wade A and Kyle Linda F
Current Estimated Value
Home Financials for this Owner
Home Financials are based on the most recent Mortgage that was taken out on this home.
Original Mortgage
$147,513
Outstanding Balance
$39,514
Interest Rate
7.24%
Mortgage Type
FHA
Estimated Equity
$677,331
Purchase Details
Closed on
Feb 4, 1999
Sold by
Rodriguez Ivo
Bought by
Federal National Mortgage Association
Purchase Details
Closed on
May 8, 1995
Sold by
Headlands Mtg Company
Bought by
Rodriguez Ivo
Home Financials for this Owner
Home Financials are based on the most recent Mortgage that was taken out on this home.
Original Mortgage
$111,600
Interest Rate
7.74%
Purchase Details
Closed on
Dec 2, 1994
Sold by
Ferguson Elvia
Bought by
Headlands Mtg Company
Create a Home Valuation Report for This Property
The Home Valuation Report is an in-depth analysis detailing your home's value as well as a comparison with similar homes in the area
Home Values in the Area
Average Home Value in this Area
Purchase History
| Date | Buyer | Sale Price | Title Company |
|---|---|---|---|
| Kyle Wade A | $148,500 | Chicago Title Co | |
| Federal National Mortgage Association | $133,022 | Chicago Title Co | |
| Rodriguez Ivo | $139,500 | Orange Coast Title Co | |
| Headlands Mtg Company | $149,000 | Northern Counties Title Ins |
Source: Public Records
Mortgage History
| Date | Status | Borrower | Loan Amount |
|---|---|---|---|
| Open | Kyle Wade A | $147,513 | |
| Previous Owner | Rodriguez Ivo | $111,600 |
Source: Public Records
Tax History Compared to Growth
Tax History
| Year | Tax Paid | Tax Assessment Tax Assessment Total Assessment is a certain percentage of the fair market value that is determined by local assessors to be the total taxable value of land and additions on the property. | Land | Improvement |
|---|---|---|---|---|
| 2025 | $5,905 | $228,247 | $57,063 | $171,184 |
| 2024 | $5,905 | $223,771 | $55,944 | $167,827 |
| 2023 | $5,678 | $219,383 | $54,847 | $164,536 |
| 2022 | $5,429 | $215,082 | $53,772 | $161,310 |
| 2021 | $5,408 | $210,865 | $52,718 | $158,147 |
| 2020 | $5,387 | $208,702 | $52,177 | $156,525 |
| 2019 | $5,331 | $204,610 | $51,154 | $153,456 |
| 2018 | $5,675 | $200,598 | $50,151 | $150,447 |
| 2017 | $5,594 | $196,665 | $49,168 | $147,497 |
| 2016 | $2,807 | $192,809 | $48,204 | $144,605 |
| 2015 | $2,802 | $189,913 | $47,480 | $142,433 |
| 2014 | $2,646 | $186,193 | $46,550 | $139,643 |
Source: Public Records
Map
Nearby Homes
- 6559 Pacifica Ave
- 17222 Fern St
- 17072 Fern St
- 7159 Kempster Ave
- 7004 Newport Ave
- 16827 Dove Tree Ln
- 16936 Baseline Ave
- 6832 Manchester Ct
- 16540 Cadence Ln
- 16502 Cadence Ln
- 16838 Kittansett Place
- 17475 Jackson Dr
- 16780 Spy Glass Ct
- 7470 Blanchard Ave
- 16530 Picardy Place
- 6065 Camargo Place
- 6112 Firestone Dr
- 16737 Kalmia Ln
- 16539 Pismo Way
- 17571 Shamrock Ave
- 6681 Kaiser Ave
- 6691 Kaiser Ave
- 6671 Kaiser Ave
- 17260 Farwell St
- 6655 Kaiser Ave
- 17261 Cambria Ave
- 17250 Farwell St
- 6651 Kaiser Ave
- 17251 Cambria Ave
- 17240 Farwell St
- 6645 Kaiser Ave
- 6735 Kaiser Ave
- 17241 Cambria Ave
- 6650 Kaiser Ave
- 17294 Los Cedros Ave
- 17230 Farwell St
- 17282 Los Cedros Ave
- 6641 Kaiser Ave
- 6741 Kaiser Ave
- 17270 Los Cedros Ave