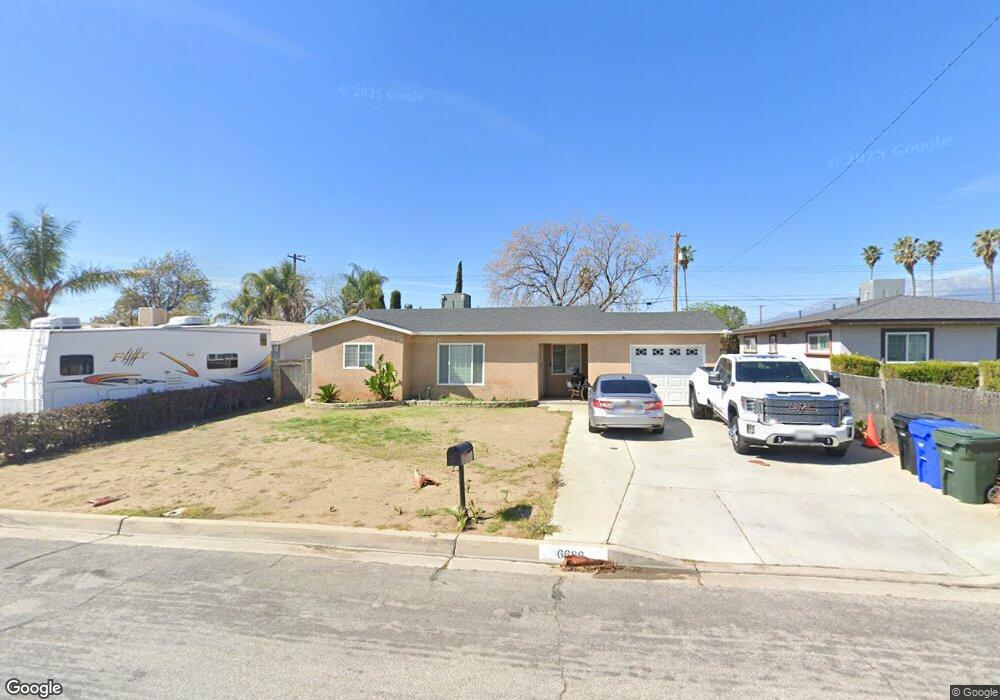
6686 Fillmore Ave Rialto, CA 92376
Estimated Value: $493,845 - $546,000
3
Beds
2
Baths
1,294
Sq Ft
$403/Sq Ft
Est. Value
About This Home
This home is located at 6686 Fillmore Ave, Rialto, CA 92376 and is currently estimated at $521,211, approximately $402 per square foot. 6686 Fillmore Ave is a home located in San Bernardino County with nearby schools including Elizabeth T. Hughbanks Elementary School, Kolb Middle School, and Wilmer Amina Carter High School.
Ownership History
Date
Name
Owned For
Owner Type
Purchase Details
Closed on
Jun 2, 2021
Sold by
Pratt Edward John and Pratt Carlene Y
Bought by
Pratt Carlene Y and Pratt Edward John
Current Estimated Value
Home Financials for this Owner
Home Financials are based on the most recent Mortgage that was taken out on this home.
Original Mortgage
$300,000
Outstanding Balance
$271,613
Interest Rate
2.9%
Mortgage Type
New Conventional
Estimated Equity
$249,598
Purchase Details
Closed on
Sep 14, 1999
Sold by
Cantu Michael G
Bought by
Pratt Edward John and Pratt Carlene Y
Home Financials for this Owner
Home Financials are based on the most recent Mortgage that was taken out on this home.
Original Mortgage
$86,367
Interest Rate
7.75%
Mortgage Type
FHA
Purchase Details
Closed on
Mar 18, 1999
Sold by
Osgood James B
Bought by
Cantu Michael G
Create a Home Valuation Report for This Property
The Home Valuation Report is an in-depth analysis detailing your home's value as well as a comparison with similar homes in the area
Home Values in the Area
Average Home Value in this Area
Purchase History
| Date | Buyer | Sale Price | Title Company |
|---|---|---|---|
| Pratt Carlene Y | -- | Fidelity Natl Ttl Orange Cnt | |
| Pratt Edward John | $86,500 | First American Title Ins Co | |
| Cantu Michael G | $45,000 | First American Title Ins Co |
Source: Public Records
Mortgage History
| Date | Status | Borrower | Loan Amount |
|---|---|---|---|
| Open | Pratt Carlene Y | $300,000 | |
| Previous Owner | Pratt Edward John | $86,367 | |
| Closed | Pratt Edward John | $4,325 |
Source: Public Records
Tax History Compared to Growth
Tax History
| Year | Tax Paid | Tax Assessment Tax Assessment Total Assessment is a certain percentage of the fair market value that is determined by local assessors to be the total taxable value of land and additions on the property. | Land | Improvement |
|---|---|---|---|---|
| 2025 | $3,468 | $282,962 | $92,389 | $190,573 |
| 2024 | $3,468 | $277,413 | $90,577 | $186,836 |
| 2023 | $3,683 | $271,974 | $88,801 | $183,173 |
| 2022 | $3,422 | $266,641 | $87,060 | $179,581 |
| 2021 | $1,728 | $122,828 | $30,708 | $92,120 |
| 2020 | $1,734 | $121,568 | $30,393 | $91,175 |
| 2019 | $1,698 | $119,184 | $29,797 | $89,387 |
| 2018 | $1,495 | $116,847 | $29,213 | $87,634 |
| 2017 | $1,484 | $114,556 | $28,640 | $85,916 |
| 2016 | $1,467 | $112,309 | $28,078 | $84,231 |
| 2015 | $1,474 | $110,622 | $27,656 | $82,966 |
| 2014 | $1,380 | $108,455 | $27,114 | $81,341 |
Source: Public Records
Map
Nearby Homes
- 6795 Fillmore Ave
- 19487 Chaparral St
- 19244 Casmalia St
- 1861 N Lilac Ave
- 1760 N Vista Ave
- 1839 N Millard Ave
- 1074 W Casmalia St
- 19538 Cheshire St
- 301 W Easton St
- 1122 W Galway St
- 763 W Virginia St
- 1148 Thunderchief Ln
- 1347 Yeager Ave
- 1231 Yeager Ave
- 178 W Walnut Ave Unit D
- 6210 Riverside Ave
- 2425 N Fillmore Ave
- Residence Two Plan at Renaissance - Outbound
- Residence Three Plan at Renaissance - Runway
- Residence Two Plan at Renaissance - Runway
- 6696 Fillmore Ave
- 6676 Fillmore Ave
- 6702 Fillmore Ave
- 6666 Fillmore Ave
- 6687 Brampton Ave
- 6695 Brampton Ave
- 6675 Brampton Ave
- 6703 Brampton Ave
- 6665 Brampton Ave
- 6708 Fillmore Ave
- 6658 Fillmore Ave
- 6681 Fillmore Ave
- 6689 Fillmore Ave
- 6671 Fillmore Ave
- 6699 Fillmore Ave
- 6709 Brampton Ave
- 6657 Brampton Ave
- 6661 Fillmore Ave
- 6718 Fillmore Ave
- 6646 Fillmore Ave