669 Anderson Rd Sebago, ME 04029
Estimated Value: $541,000 - $1,004,000
--
Bed
--
Bath
672
Sq Ft
$1,146/Sq Ft
Est. Value
About This Home
This home is located at 669 Anderson Rd, Sebago, ME 04029 and is currently estimated at $770,143, approximately $1,146 per square foot. 669 Anderson Rd is a home with nearby schools including Lake Region High School.
Ownership History
Date
Name
Owned For
Owner Type
Purchase Details
Closed on
Dec 27, 2024
Sold by
Thompson Gene C
Bought by
Gene C Thompson Lt and Thompson
Current Estimated Value
Purchase Details
Closed on
Aug 15, 2023
Sold by
Thompson Eric W
Bought by
Thompson Lt and Thompson
Purchase Details
Closed on
Nov 2, 2005
Sold by
Haskell Edith B Est and Thompson
Bought by
Edith Haskell Ret and Thompson
Create a Home Valuation Report for This Property
The Home Valuation Report is an in-depth analysis detailing your home's value as well as a comparison with similar homes in the area
Home Values in the Area
Average Home Value in this Area
Purchase History
| Date | Buyer | Sale Price | Title Company |
|---|---|---|---|
| Gene C Thompson Lt | -- | None Available | |
| Gene C Thompson Lt | -- | None Available | |
| Thompson Lt | -- | None Available | |
| Thompson Lt | -- | None Available | |
| Thompson Lt | -- | None Available | |
| Edith Haskell Ret | -- | -- | |
| Edith Haskell Ret | -- | -- |
Source: Public Records
Tax History Compared to Growth
Tax History
| Year | Tax Paid | Tax Assessment Tax Assessment Total Assessment is a certain percentage of the fair market value that is determined by local assessors to be the total taxable value of land and additions on the property. | Land | Improvement |
|---|---|---|---|---|
| 2024 | $7,196 | $527,535 | $439,660 | $87,875 |
| 2023 | $6,847 | $527,535 | $439,660 | $87,875 |
| 2022 | $5,486 | $527,535 | $439,660 | $87,875 |
| 2021 | $5,196 | $527,535 | $439,660 | $87,875 |
| 2020 | $5,830 | $414,954 | $355,725 | $59,229 |
| 2019 | $5,643 | $414,954 | $355,725 | $59,229 |
| 2018 | $5,457 | $414,954 | $355,725 | $59,229 |
| 2017 | $5,374 | $414,954 | $355,725 | $59,229 |
| 2016 | $5,104 | $414,954 | $355,725 | $59,229 |
| 2015 | $5,436 | $414,954 | $355,725 | $59,229 |
| 2014 | $5,535 | $414,954 | $355,725 | $59,229 |
Source: Public Records
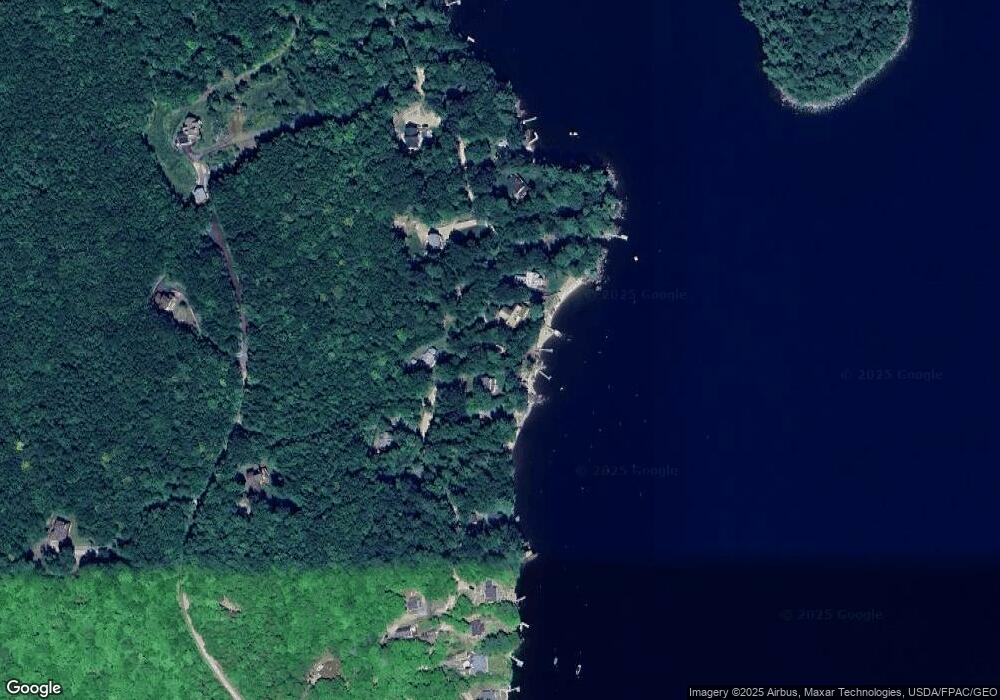
Map
Nearby Homes
- 878 Anderson Rd
- 83 Safe Harbor Rd
- Lot 5 Rocky Ridge Rd
- Lot 6 Rocky Ridge Rd
- 6-3 Boulder Beach Rd
- Lot 8 Northwood Estates
- Lot 12 Rocky Ridge Rd
- Lot 12 Alderberry Bay Dr
- 290 Gore Rd
- 0 Pleasant View Dr
- 263 Gore Rd
- 41 Lakeview Dr
- 95 Harbor Rd
- 131 Harbor Rd
- 214 Gore Rd
- 31 Pleasant View Dr
- 41 Busy Bee
- Lot 11 Dillingham Rd
- 91 Gore Rd
- 87 & 91 Gore
- 715 Anderson Rd
- 666 Anderson Rd
- 685 Anderson Rd
- 687 Anderson Rd
- 689 Anderson Rd
- 695 Anderson Rd
- 703 Anderson Rd
- 711 Anderson Rd
- 716 Anderson Rd
- 611 Anderson Rd
- 719 Anderson Rd
- Lot 13 & 4 Taralaine Rd
- Lot 13 & 1 Taralaine Rd
- Lot 7 Taralaine Rd
- Lot 1 Taralaine Rd
- 31 Taralaine Rd
- 603 Anderson Rd
- 606 Anderson Rd
- 591 Anderson Rd
- 0 Taralaine Rd