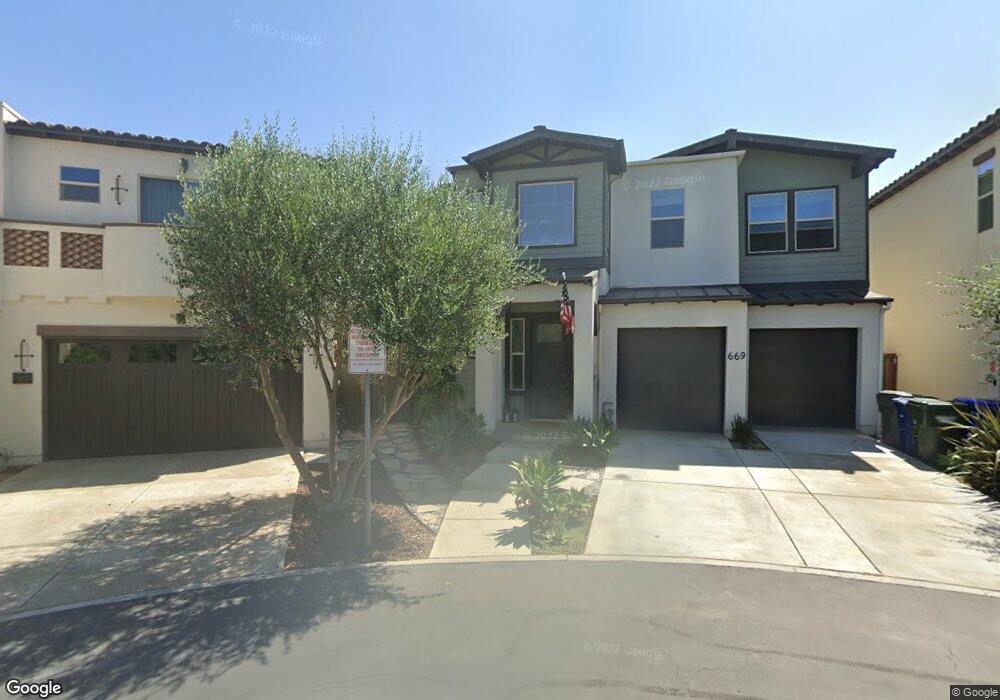
669 Calypso Place Encinitas, CA 92024
Leucadia NeighborhoodEstimated Value: $2,729,184 - $3,661,000
3
Beds
3
Baths
2,195
Sq Ft
$1,392/Sq Ft
Est. Value
About This Home
This home is located at 669 Calypso Place, Encinitas, CA 92024 and is currently estimated at $3,055,546, approximately $1,392 per square foot. 669 Calypso Place is a home located in San Diego County with nearby schools including Paul Ecke-Central Elementary, Diegueno Middle School, and La Costa Canyon High School.
Ownership History
Date
Name
Owned For
Owner Type
Purchase Details
Closed on
Jul 16, 2019
Sold by
Wynn Gregory Darren
Bought by
Wynn Gregory D
Current Estimated Value
Purchase Details
Closed on
Dec 4, 2018
Sold by
Wynn Gregory Darren and Peale Sarah Kathleen
Bought by
Wynn Gregory Darren
Home Financials for this Owner
Home Financials are based on the most recent Mortgage that was taken out on this home.
Original Mortgage
$1,036,000
Outstanding Balance
$888,403
Interest Rate
3.75%
Mortgage Type
Adjustable Rate Mortgage/ARM
Estimated Equity
$2,167,143
Purchase Details
Closed on
Jan 10, 2012
Sold by
Wynn Gregory Darren
Bought by
Wynn Gregory Darren and Wynn Sarah Kathleen
Home Financials for this Owner
Home Financials are based on the most recent Mortgage that was taken out on this home.
Original Mortgage
$743,600
Interest Rate
3.96%
Mortgage Type
New Conventional
Create a Home Valuation Report for This Property
The Home Valuation Report is an in-depth analysis detailing your home's value as well as a comparison with similar homes in the area
Home Values in the Area
Average Home Value in this Area
Purchase History
| Date | Buyer | Sale Price | Title Company |
|---|---|---|---|
| Wynn Gregory D | -- | None Available | |
| Wynn Gregory Darren | -- | Title Source Inc | |
| Wynn Gregory Darren | -- | Chicago Title Company | |
| Wynn Gregory Darren | $930,000 | Chicago Title | |
| Wynn Gregory Darren | -- | Chicago Title |
Source: Public Records
Mortgage History
| Date | Status | Borrower | Loan Amount |
|---|---|---|---|
| Open | Wynn Gregory Darren | $1,036,000 | |
| Closed | Wynn Gregory Darren | $743,600 |
Source: Public Records
Tax History
| Year | Tax Paid | Tax Assessment Tax Assessment Total Assessment is a certain percentage of the fair market value that is determined by local assessors to be the total taxable value of land and additions on the property. | Land | Improvement |
|---|---|---|---|---|
| 2025 | $12,920 | $1,194,525 | $853,987 | $340,538 |
| 2024 | $12,920 | $1,171,104 | $837,243 | $333,861 |
| 2023 | $12,577 | $1,148,142 | $820,827 | $327,315 |
| 2022 | $12,135 | $1,110,631 | $804,733 | $305,898 |
| 2021 | $11,845 | $1,079,051 | $788,954 | $290,097 |
| 2020 | $11,666 | $1,067,988 | $780,865 | $287,123 |
| 2019 | $11,430 | $1,047,048 | $765,554 | $281,494 |
| 2018 | $11,208 | $1,026,519 | $750,544 | $275,975 |
| 2017 | $11,010 | $1,006,392 | $735,828 | $270,564 |
| 2016 | $10,663 | $986,659 | $721,400 | $265,259 |
| 2015 | $10,486 | $971,839 | $710,564 | $261,275 |
| 2014 | $10,258 | $952,803 | $696,646 | $256,157 |
Source: Public Records
Map
Nearby Homes
- 674 Calypso Place
- 600 N Coast Highway 101
- 510 Neptune Ave
- 498 Neptune Ave
- 699 N Vulcan Ave Unit 17
- 699 N Vulcan Ave Unit 133
- 699 N Vulcan Ave Unit 134
- 699 N Vulcan Ave Unit 80
- 699 N Vulcan Ave Unit 56
- 523 N Vulcan Ave Unit SPC 24A
- 523 N Vulcan Ave Unit 3
- 523 N Vulcan Ave Unit 41
- 523 N Vulcan Ave Unit 43
- 569 Hermes Ave
- 698 Hygeia Ave
- 806 Hygeia Ave
- 123 Jasper St
- 123 Jasper St Unit spc 35
- 123 Jasper St Unit 38
- 123 Jasper St Unit 16
- 677 Calypso Place
- 668 Calypso Place
- 135 Daphne St
- 685 Calypso Place
- 654 N Coast Highway 101
- 682 Calypso Place
- 693 Calypso Place
- 690 Calypso Place
- 699 Calypso Place
- 120 Cadmus St Unit 120
- 120 Cadmus St
- 120 Cadmus St
- 161 Daphne St
- 181 Daphne St Unit A
- 640 N Coast Highway 101
- 126 Cadmus St
- 698 Calypso Place
- 130 Cadmus St Unit 132
- 130 Cadmus St
- 657 Neptune Ave Unit 59
Your Personal Tour Guide
Ask me questions while you tour the home.