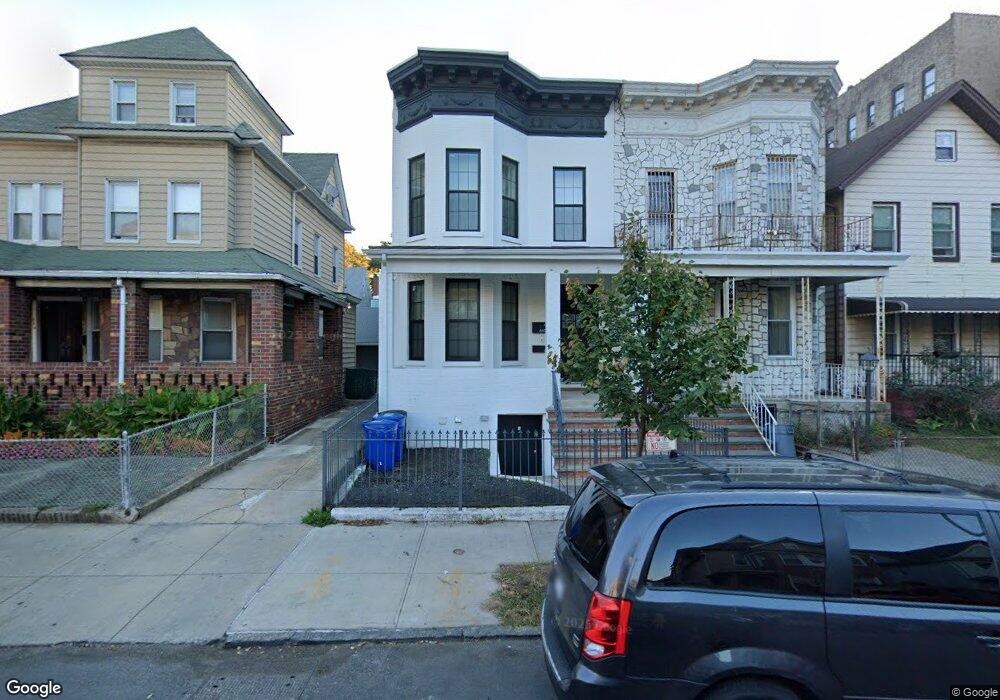
669 E 31 St Brooklyn, NY 11210
Flatbush NeighborhoodEstimated Value: $998,000 - $1,435,000
5
Beds
--
Bath
3,046
Sq Ft
$398/Sq Ft
Est. Value
About This Home
This home is located at 669 E 31 St, Brooklyn, NY 11210 and is currently estimated at $1,212,298, approximately $397 per square foot. 669 E 31 St is a home located in Kings County with nearby schools including J.H.S. 278 Marine Park, Jhs 234 Arthur W Cunningham, and Jhs 14 Shell Bank.
Ownership History
Date
Name
Owned For
Owner Type
Purchase Details
Closed on
Oct 16, 2019
Sold by
31 Realty Properties Inc
Bought by
Bencheikh Amine and Novak April
Current Estimated Value
Home Financials for this Owner
Home Financials are based on the most recent Mortgage that was taken out on this home.
Original Mortgage
$864,800
Outstanding Balance
$752,658
Interest Rate
3.4%
Mortgage Type
Purchase Money Mortgage
Estimated Equity
$459,640
Purchase Details
Closed on
Jul 6, 2017
Sold by
Truong Thuy
Bought by
31 Realty Properties Inc
Purchase Details
Closed on
May 16, 2006
Sold by
Chan Sandra
Bought by
Truong Thuy
Home Financials for this Owner
Home Financials are based on the most recent Mortgage that was taken out on this home.
Original Mortgage
$97,185
Interest Rate
6.55%
Purchase Details
Closed on
Oct 31, 2003
Sold by
Chan Hinston and Chan Sandra
Bought by
Chan Sandra
Create a Home Valuation Report for This Property
The Home Valuation Report is an in-depth analysis detailing your home's value as well as a comparison with similar homes in the area
Home Values in the Area
Average Home Value in this Area
Purchase History
| Date | Buyer | Sale Price | Title Company |
|---|---|---|---|
| Bencheikh Amine | $1,086,000 | -- | |
| Bencheikh Amine | $1,086,000 | -- | |
| Bencheikh Amine | $1,086,000 | -- | |
| 31 Realty Properties Inc | $350,000 | -- | |
| 31 Realty Properties Inc | $350,000 | -- | |
| 31 Realty Properties Inc | $350,000 | -- | |
| Truong Thuy | $485,925 | -- | |
| Truong Thuy | $485,925 | -- | |
| Truong Thuy | $485,925 | -- | |
| Chan Sandra | -- | -- | |
| Chan Sandra | -- | -- |
Source: Public Records
Mortgage History
| Date | Status | Borrower | Loan Amount |
|---|---|---|---|
| Open | Bencheikh Amine | $864,800 | |
| Closed | Bencheikh Amine | $864,800 | |
| Previous Owner | Truong Thuy | $97,185 | |
| Previous Owner | Truong Thuy | $388,740 | |
| Closed | Chan Sandra | $0 |
Source: Public Records
Tax History
| Year | Tax Paid | Tax Assessment Tax Assessment Total Assessment is a certain percentage of the fair market value that is determined by local assessors to be the total taxable value of land and additions on the property. | Land | Improvement |
|---|---|---|---|---|
| 2025 | $6,597 | $59,580 | $19,800 | $39,780 |
| 2024 | $6,597 | $47,700 | $19,800 | $27,900 |
| 2023 | $6,347 | $51,300 | $19,800 | $31,500 |
| 2022 | $5,961 | $48,360 | $19,800 | $28,560 |
| 2021 | $6,032 | $45,420 | $19,800 | $25,620 |
| 2020 | $2,999 | $55,080 | $19,800 | $35,280 |
| 2019 | $5,726 | $53,580 | $19,800 | $33,780 |
| 2018 | $5,309 | $26,043 | $10,016 | $16,027 |
| 2017 | $5,072 | $24,883 | $13,308 | $11,575 |
| 2016 | $4,775 | $23,886 | $12,512 | $11,374 |
| 2015 | $2,611 | $23,886 | $13,033 | $10,853 |
| 2014 | $2,611 | $22,809 | $14,934 | $7,875 |
Source: Public Records
Map
Nearby Homes
- 627 E 32nd St
- 720 E 31st St Unit 5K
- 720 E 31st St Unit 4K
- 720 E 32nd St Unit 5G
- 563 E 32nd St
- 1525 Flatbush Ave
- 745 E 31st St Unit 2M
- 745 E 31st St Unit 2L
- 745 E 31st St Unit 5K
- 745 E 31st St Unit 4C
- 745 E 31st St Unit 4B
- 745 E 31st St Unit 6J
- 579 E 29th St
- 1462 New York Ave
- 2816 Glenwood Rd
- 93 Kenilworth Place
- 1470 Flatbush Ave
- 1462 Flatbush Ave Unit 2D
- 785 E 34th St Unit 3-C
- 145 Kenilworth Place Unit 2A
- 669 E 31st St
- 671 E 31st St
- 665 E 31st St
- 675 E 31st St
- 675 E 31st St Unit 2
- 659 E 31st St
- 657 E 31st St
- 670 E 32nd St
- 666 E 32nd St
- 674 E 32nd St
- 662 E 32nd St
- 655 E 31st St
- 3111 Glenwood Rd
- 658 E 32nd St
- 651 E 31st St
- 3115 Glenwood Rd
- 676 E 31 St
- 668 E 31st St
- 668 E 31st St Unit 2
- 668 E 31st St Unit 3
Your Personal Tour Guide
Ask me questions while you tour the home.