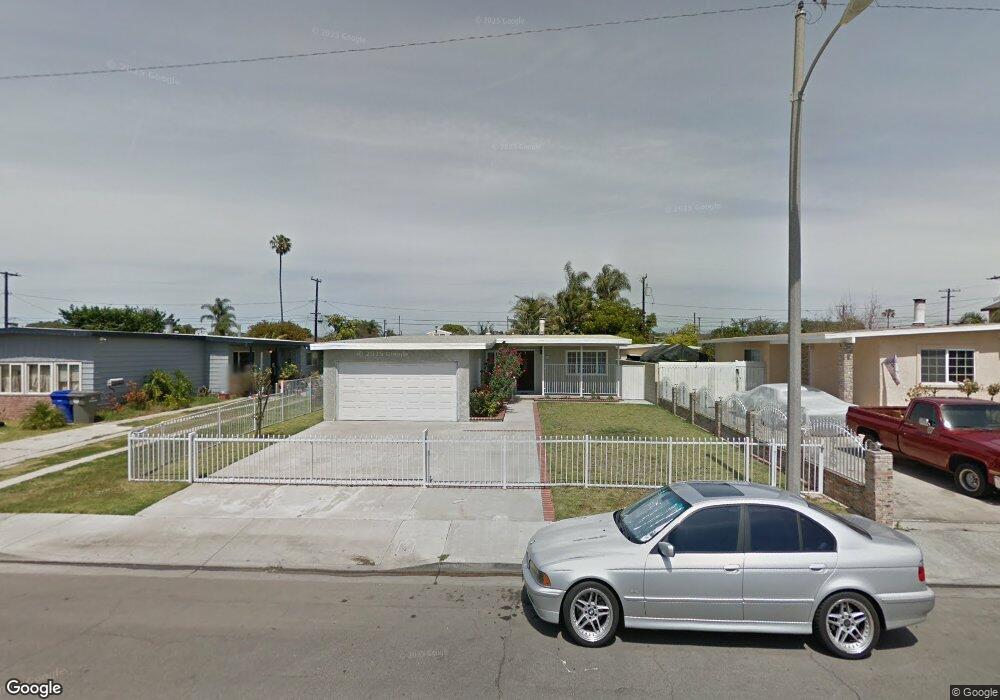
669 E Scott St Port Hueneme, CA 93041
Estimated Value: $672,000 - $738,000
4
Beds
2
Baths
1,548
Sq Ft
$456/Sq Ft
Est. Value
About This Home
This home is located at 669 E Scott St, Port Hueneme, CA 93041 and is currently estimated at $705,560, approximately $455 per square foot. 669 E Scott St is a home located in Ventura County with nearby schools including Richard Bard Elementary School and Hueneme High School.
Ownership History
Date
Name
Owned For
Owner Type
Purchase Details
Closed on
Nov 19, 2008
Sold by
Hsbc Bank Usa
Bought by
Nguyen Phuong Duy and Do Lien Ngoc
Current Estimated Value
Home Financials for this Owner
Home Financials are based on the most recent Mortgage that was taken out on this home.
Original Mortgage
$204,000
Outstanding Balance
$134,439
Interest Rate
6.16%
Mortgage Type
Purchase Money Mortgage
Estimated Equity
$571,121
Purchase Details
Closed on
Feb 26, 2008
Sold by
Villa Ruben
Bought by
Hsbc Bank Usa Na
Purchase Details
Closed on
Jul 29, 2005
Sold by
Martinez Sandra
Bought by
Villa Ruben
Home Financials for this Owner
Home Financials are based on the most recent Mortgage that was taken out on this home.
Original Mortgage
$494,495
Interest Rate
6.08%
Mortgage Type
New Conventional
Purchase Details
Closed on
Aug 9, 2004
Sold by
Avellaneda Yolanda L
Bought by
Villa Ruben and Martinez Sandra
Home Financials for this Owner
Home Financials are based on the most recent Mortgage that was taken out on this home.
Original Mortgage
$373,600
Interest Rate
6.5%
Mortgage Type
Purchase Money Mortgage
Purchase Details
Closed on
Jul 1, 2004
Sold by
Avellaneda Carlos
Bought by
Avellanada Yolanda L
Home Financials for this Owner
Home Financials are based on the most recent Mortgage that was taken out on this home.
Original Mortgage
$373,600
Interest Rate
6.5%
Mortgage Type
Purchase Money Mortgage
Purchase Details
Closed on
Jun 1, 2004
Sold by
Bedolla Rigoberto C and Bedolla Oralia
Bought by
Avellaneda Yolanda L
Home Financials for this Owner
Home Financials are based on the most recent Mortgage that was taken out on this home.
Original Mortgage
$344,800
Interest Rate
5.99%
Mortgage Type
Purchase Money Mortgage
Purchase Details
Closed on
Sep 13, 2001
Sold by
Hampton James W
Bought by
Bedolla Rigoberto C and Bedolla Oralia
Home Financials for this Owner
Home Financials are based on the most recent Mortgage that was taken out on this home.
Original Mortgage
$174,675
Interest Rate
8%
Purchase Details
Closed on
Jul 2, 2001
Sold by
Hampton Victoria
Bought by
Hampton James W
Purchase Details
Closed on
May 22, 1996
Sold by
Hampton Jodi L
Bought by
Hampton James W
Home Financials for this Owner
Home Financials are based on the most recent Mortgage that was taken out on this home.
Original Mortgage
$163,950
Interest Rate
8.07%
Mortgage Type
VA
Create a Home Valuation Report for This Property
The Home Valuation Report is an in-depth analysis detailing your home's value as well as a comparison with similar homes in the area
Home Values in the Area
Average Home Value in this Area
Purchase History
| Date | Buyer | Sale Price | Title Company |
|---|---|---|---|
| Nguyen Phuong Duy | $255,000 | Fidelity National Title Co | |
| Hsbc Bank Usa Na | $498,504 | None Available | |
| Villa Ruben | -- | First American Title Company | |
| Villa Ruben | $467,000 | First American Title Co | |
| Avellanada Yolanda L | -- | Ticor Title Company Of Ca | |
| Avellaneda Yolanda L | $431,000 | Ticor Title Company Of Ca | |
| Bedolla Rigoberto C | $233,000 | American Title Co | |
| Hampton James W | -- | American Title Co | |
| Hampton James W | -- | United Title Company |
Source: Public Records
Mortgage History
| Date | Status | Borrower | Loan Amount |
|---|---|---|---|
| Open | Nguyen Phuong Duy | $204,000 | |
| Previous Owner | Villa Ruben | $494,495 | |
| Previous Owner | Villa Ruben | $373,600 | |
| Previous Owner | Avellaneda Yolanda L | $344,800 | |
| Previous Owner | Bedolla Rigoberto C | $174,675 | |
| Previous Owner | Hampton James W | $163,950 | |
| Closed | Bedolla Rigoberto C | $34,935 | |
| Closed | Avellaneda Yolanda L | $86,200 | |
| Closed | Villa Ruben | $93,400 |
Source: Public Records
Tax History Compared to Growth
Tax History
| Year | Tax Paid | Tax Assessment Tax Assessment Total Assessment is a certain percentage of the fair market value that is determined by local assessors to be the total taxable value of land and additions on the property. | Land | Improvement |
|---|---|---|---|---|
| 2025 | $3,971 | $328,362 | $213,761 | $114,601 |
| 2024 | $3,971 | $321,924 | $209,570 | $112,354 |
| 2023 | $3,777 | $315,612 | $205,461 | $110,151 |
| 2022 | $3,675 | $309,424 | $201,432 | $107,992 |
| 2021 | $3,673 | $303,357 | $197,482 | $105,875 |
| 2020 | $3,631 | $300,249 | $195,458 | $104,791 |
| 2019 | $3,582 | $294,363 | $191,626 | $102,737 |
| 2018 | $3,465 | $288,592 | $187,869 | $100,723 |
| 2017 | $3,342 | $282,935 | $184,186 | $98,749 |
| 2016 | $3,245 | $277,388 | $180,575 | $96,813 |
| 2015 | $3,167 | $273,222 | $177,863 | $95,359 |
| 2014 | $3,135 | $267,872 | $174,380 | $93,492 |
Source: Public Records
Map
Nearby Homes
- 632 Joyce Dr
- 117 Ann Ave
- 664 Beachport Dr
- 168 Courtyard Dr
- 181 Courtyard Dr
- 5420 S J St
- 420 Village Rd
- 303 Blue Dolphin Dr
- 755 Ocean Breeze Dr
- 655 Dahl Ave
- 626 Island View Cir
- 470 Sanddollar Ln
- 5233 Perkins Rd
- 618 Island View Cir Unit 618
- 541 Cuesta Del Mar Dr
- 201 S Ventura Rd Unit 15
- 233 N 3rd St
- 558 Terrace View Place
- 225 S Ventura Rd Unit 102
- 225 S Ventura Rd Unit 79