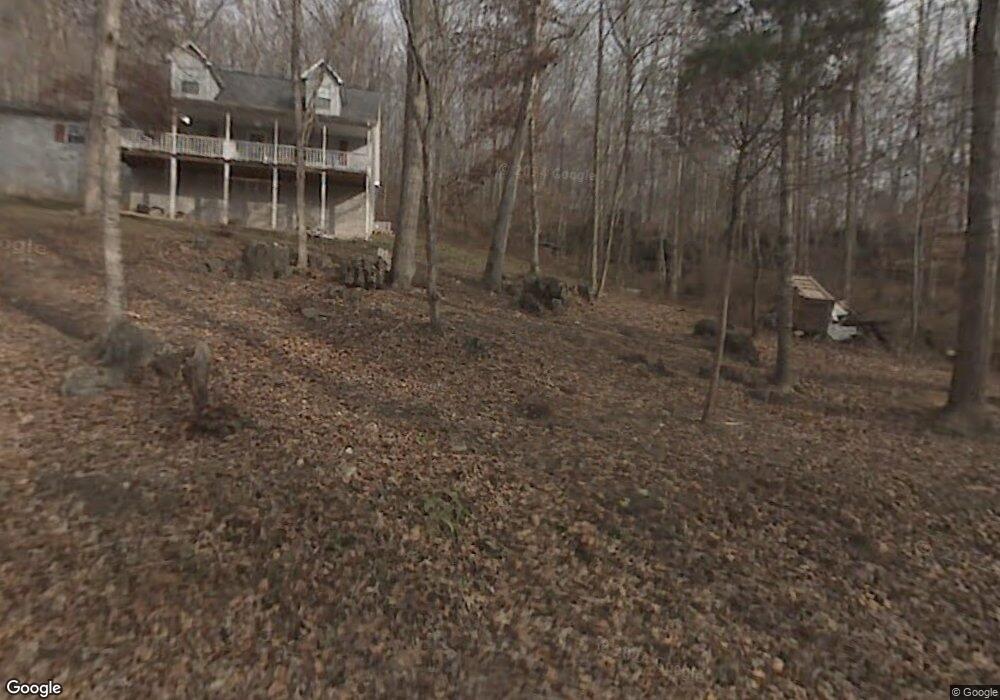
669 Low Gap Rd La Follette, TN 37766
Estimated Value: $294,000 - $412,000
3
Beds
2
Baths
1,217
Sq Ft
$275/Sq Ft
Est. Value
About This Home
This home is located at 669 Low Gap Rd, La Follette, TN 37766 and is currently estimated at $334,144, approximately $274 per square foot. 669 Low Gap Rd is a home located in Campbell County.
Ownership History
Date
Name
Owned For
Owner Type
Purchase Details
Closed on
Nov 14, 2012
Sold by
Secretary Of Housing And U
Bought by
Phillips Cody D and Phillips Jessica L
Current Estimated Value
Home Financials for this Owner
Home Financials are based on the most recent Mortgage that was taken out on this home.
Original Mortgage
$69,851
Outstanding Balance
$49,736
Interest Rate
4.12%
Mortgage Type
FHA
Estimated Equity
$284,408
Purchase Details
Closed on
Apr 11, 2012
Bought by
Secretary Of Housing And Urban Development Th
Purchase Details
Closed on
Mar 25, 2004
Sold by
Household Financial Center
Bought by
Lagrone William P and Lagrone Charlene
Purchase Details
Closed on
Oct 9, 2003
Bought by
Household Financial Center
Purchase Details
Closed on
Nov 30, 1994
Bought by
Schneider Jeff Debra
Create a Home Valuation Report for This Property
The Home Valuation Report is an in-depth analysis detailing your home's value as well as a comparison with similar homes in the area
Home Values in the Area
Average Home Value in this Area
Purchase History
| Date | Buyer | Sale Price | Title Company |
|---|---|---|---|
| Phillips Cody D | $70,000 | -- | |
| Secretary Of Housing And Urban Development Th | -- | -- | |
| The Secretary Of Housing And U | $168,041 | -- | |
| Lagrone William P | $74,900 | -- | |
| Household Financial Center | $78,658 | -- | |
| Schneider Jeff Debra | $10,000 | -- |
Source: Public Records
Mortgage History
| Date | Status | Borrower | Loan Amount |
|---|---|---|---|
| Open | Phillips Cody D | $69,851 |
Source: Public Records
Tax History
| Year | Tax Paid | Tax Assessment Tax Assessment Total Assessment is a certain percentage of the fair market value that is determined by local assessors to be the total taxable value of land and additions on the property. | Land | Improvement |
|---|---|---|---|---|
| 2025 | $684 | $56,275 | $12,050 | $44,225 |
| 2024 | $684 | $56,275 | $12,050 | $44,225 |
| 2023 | $617 | $29,850 | $7,325 | $22,525 |
| 2022 | $617 | $29,850 | $7,325 | $22,525 |
| 2021 | $617 | $29,850 | $7,325 | $22,525 |
| 2020 | $605 | $29,850 | $7,325 | $22,525 |
| 2019 | $617 | $29,850 | $7,325 | $22,525 |
| 2018 | $566 | $25,150 | $5,375 | $19,775 |
| 2017 | $566 | $25,150 | $5,375 | $19,775 |
| 2016 | $566 | $25,150 | $5,375 | $19,775 |
| 2015 | $500 | $25,150 | $5,375 | $19,775 |
| 2014 | $500 | $25,150 | $5,375 | $19,775 |
| 2013 | -- | $25,150 | $5,375 | $19,775 |
Source: Public Records
Map
Nearby Homes
- 0 Whitman Hollow Rd Unit 1329000
- 519 Whitman Hollow Rd
- 148 Durkee Hollow Ln
- 0 Grantsboro Rd
- 0 Clearwater View Ln Unit 1317048
- 0 Country Oaks Ln
- 550 Quail Run Ln
- 0 Lot 287 Villages Ll Unit 1326937
- 303 Tar Town Hollow Ln
- 0 Sugar Hollow Rd Unit RTC3070915
- Lot 0 Sugar Hollow Rd
- 299 Tar Town Hollow Ln
- 1914 Pleasant Ridge Rd
- 0 Big Creek Rd Unit 1324237
- 0 Rainbow View Rd
- 717 Country Oaks Ln
- 0 Kay Dr Unit 1325453
- 1514 Chestnut Stump Rd
- 0 Big Creek Lot 21 Ln Unit 1290502
- 1939 Pleasant Ridge Rd
- 586 Low Gap Rd
- 519 Low Gap Rd
- 523 Low Gap Rd
- 523 Low Gap Rd
- 743 Whitman Hollow Rd
- 258 Hatmaker Ln
- 194 Raymond Rd
- 222 Hatmaker Ln
- 999 Low Gap Rd
- 496 Leroy Day Ln
- 222 Ginnie Ln
- 222 Whitman Hollow Rd
- 1000 Low Gap Rd
- 158 Hatmaker Ln
- 158 Hatmaker Ln
- 294 Housley Ln
- 957 Whitman Hollow Rd
- 281 Housley Ln
- 949 Whitman Hollow Rd
- 340 Sharpwood Ln
Your Personal Tour Guide
Ask me questions while you tour the home.