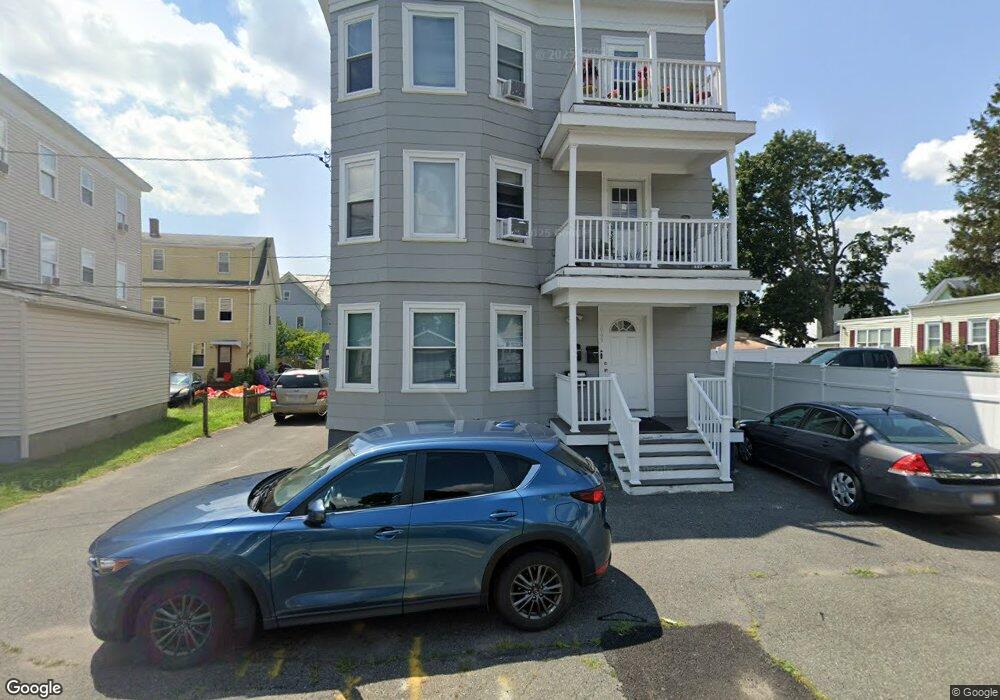
669 Montello St Brockton, MA 02301
Clifton Heights NeighborhoodEstimated Value: $783,000 - $913,000
6
Beds
3
Baths
3,144
Sq Ft
$269/Sq Ft
Est. Value
About This Home
This home is located at 669 Montello St, Brockton, MA 02301 and is currently estimated at $846,000, approximately $269 per square foot. 669 Montello St is a home located in Plymouth County with nearby schools including Gilmore Elementary School, Davis K-8 School, and John F. Kennedy Elementary School.
Ownership History
Date
Name
Owned For
Owner Type
Purchase Details
Closed on
May 28, 1998
Sold by
Rice Robert
Bought by
Lindo Lascelles G and Lindo Diana R
Current Estimated Value
Purchase Details
Closed on
Feb 7, 1996
Sold by
Fhlmc
Bought by
Rice Robert
Purchase Details
Closed on
Jul 12, 1995
Sold by
Chapman Gary and Chapman Constance
Bought by
Fhlmc
Create a Home Valuation Report for This Property
The Home Valuation Report is an in-depth analysis detailing your home's value as well as a comparison with similar homes in the area
Home Values in the Area
Average Home Value in this Area
Purchase History
| Date | Buyer | Sale Price | Title Company |
|---|---|---|---|
| Lindo Lascelles G | $100,000 | -- | |
| Rice Robert | $53,000 | -- | |
| Fhlmc | $69,210 | -- |
Source: Public Records
Mortgage History
| Date | Status | Borrower | Loan Amount |
|---|---|---|---|
| Open | Fhlmc | $135,000 | |
| Closed | Fhlmc | $130,000 | |
| Closed | Fhlmc | $25,000 |
Source: Public Records
Tax History
| Year | Tax Paid | Tax Assessment Tax Assessment Total Assessment is a certain percentage of the fair market value that is determined by local assessors to be the total taxable value of land and additions on the property. | Land | Improvement |
|---|---|---|---|---|
| 2025 | $8,214 | $678,300 | $131,200 | $547,100 |
| 2024 | $7,903 | $657,500 | $131,200 | $526,300 |
| 2023 | $7,367 | $567,600 | $99,300 | $468,300 |
| 2022 | $7,297 | $522,300 | $89,800 | $432,500 |
| 2021 | $6,679 | $460,600 | $73,800 | $386,800 |
| 2020 | $6,002 | $396,200 | $70,200 | $326,000 |
| 2019 | $5,680 | $365,500 | $66,900 | $298,600 |
| 2018 | $5,582 | $347,600 | $66,900 | $280,700 |
| 2017 | $5,076 | $315,300 | $66,900 | $248,400 |
| 2016 | $3,630 | $209,100 | $64,800 | $144,300 |
| 2015 | $2,868 | $158,000 | $64,800 | $93,200 |
| 2014 | $2,605 | $143,700 | $64,800 | $78,900 |
Source: Public Records
Map
Nearby Homes
- 675 Montello St
- 659 Montello St
- 34 Hancock St
- 34 Hancock St
- 34 Hancock St Unit 1
- 34 Hancock St Unit 3
- 26 Owens Ave
- 24 Owens Ave
- 653 Montello St
- 664 Montello St
- 28 Hancock St
- 20 Owens Ave
- 674 Montello St
- 691 Montello St
- 654 Montello St
- 16 Owens Ave
- 647 Montello St
- 29 Hancock St Unit 2
- 688 Montello St
- 10 Owens Ave
Your Personal Tour Guide
Ask me questions while you tour the home.