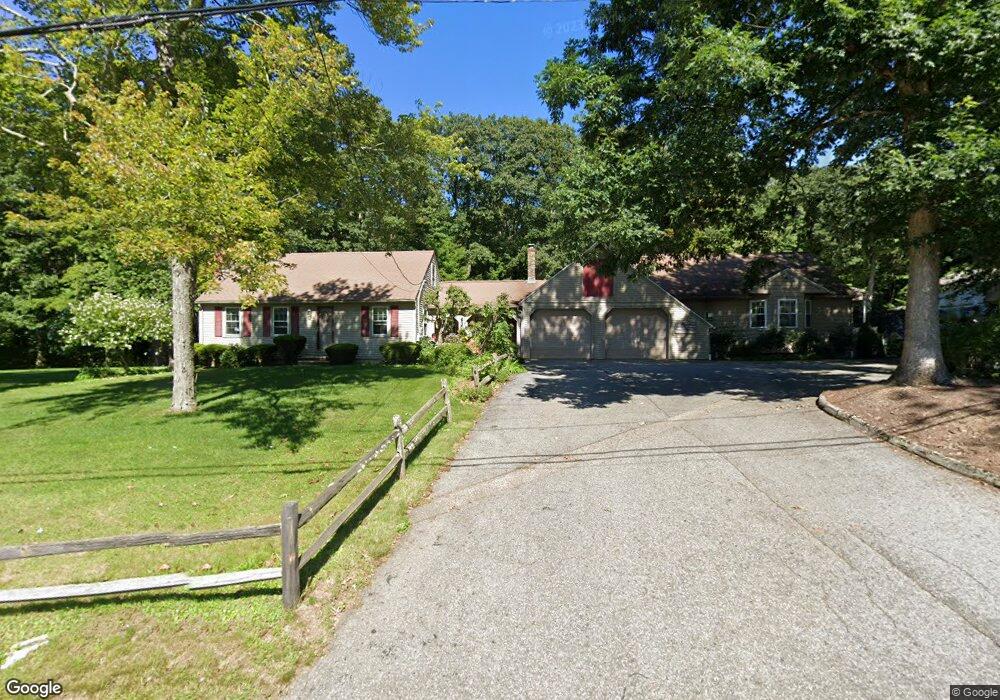
669 Podunk Rd East Brookfield, MA 01515
Estimated Value: $544,000 - $664,628
4
Beds
6
Baths
3,359
Sq Ft
$174/Sq Ft
Est. Value
About This Home
This home is located at 669 Podunk Rd, East Brookfield, MA 01515 and is currently estimated at $585,157, approximately $174 per square foot. 669 Podunk Rd is a home located in Worcester County with nearby schools including David Prouty High School.
Ownership History
Date
Name
Owned For
Owner Type
Purchase Details
Closed on
Jul 15, 1991
Sold by
Patchen Darrell J
Bought by
Brigham Mark D and Brigham Celeste
Current Estimated Value
Home Financials for this Owner
Home Financials are based on the most recent Mortgage that was taken out on this home.
Original Mortgage
$100,700
Interest Rate
9.35%
Mortgage Type
Purchase Money Mortgage
Create a Home Valuation Report for This Property
The Home Valuation Report is an in-depth analysis detailing your home's value as well as a comparison with similar homes in the area
Home Values in the Area
Average Home Value in this Area
Purchase History
| Date | Buyer | Sale Price | Title Company |
|---|---|---|---|
| Brigham Mark D | $106,000 | -- |
Source: Public Records
Mortgage History
| Date | Status | Borrower | Loan Amount |
|---|---|---|---|
| Open | Brigham Mark D | $206,000 | |
| Closed | Brigham Mark D | $104,500 | |
| Closed | Brigham Mark D | $100,700 |
Source: Public Records
Tax History Compared to Growth
Tax History
| Year | Tax Paid | Tax Assessment Tax Assessment Total Assessment is a certain percentage of the fair market value that is determined by local assessors to be the total taxable value of land and additions on the property. | Land | Improvement |
|---|---|---|---|---|
| 2025 | $7,972 | $620,900 | $73,200 | $547,700 |
| 2024 | $7,214 | $564,900 | $66,700 | $498,200 |
| 2023 | $6,839 | $521,700 | $60,600 | $461,100 |
| 2022 | $7,964 | $588,600 | $52,100 | $536,500 |
| 2021 | $7,534 | $508,000 | $52,100 | $455,900 |
| 2020 | $7,074 | $477,300 | $52,100 | $425,200 |
| 2019 | $7,229 | $438,900 | $52,100 | $386,800 |
| 2018 | $6,813 | $440,700 | $52,400 | $388,300 |
| 2017 | $6,641 | $407,900 | $48,400 | $359,500 |
| 2016 | $6,561 | $375,800 | $48,400 | $327,400 |
| 2015 | $6,524 | $375,800 | $48,400 | $327,400 |
| 2014 | $6,546 | $375,800 | $48,400 | $327,400 |
Source: Public Records
Map
Nearby Homes
- 145 Draper Rd
- 86 Jolicoeur Ave
- 172 Stone Rd
- 9 Hebert Rd
- 3 Cranberry Meadow Shore Rd
- 49 Jennings Rd
- Lot 0 N Sturbridge Rd
- 100 Rice Rd
- 45 Jennings Rd
- 216 Brookfield Rd
- 204 Brookfield Rd
- 70 Quaboag St
- 1 Lane 22
- 132 Lane 9
- 31 Lyford Rd
- 208 Sunset Dr
- Lot 3 0 N Sullivan Rd
- Lot 6 0 N Sullivan Rd
- Lot 5 0 N Sullivan Rd
- Lot 4 0 N Sullivan Rd