669 Village Green St Porterville, CA 93257
Porterville Northwest NeighborhoodEstimated Value: $299,275 - $357,000
2
Beds
2
Baths
1,490
Sq Ft
$215/Sq Ft
Est. Value
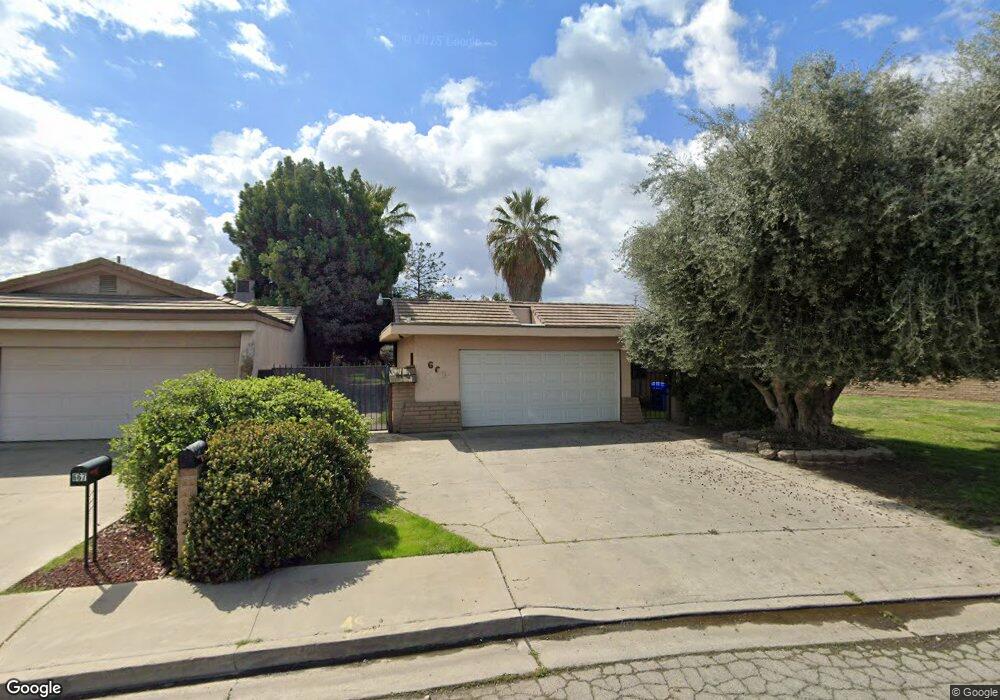
About This Home
This home is located at 669 Village Green St, Porterville, CA 93257 and is currently estimated at $320,569, approximately $215 per square foot. 669 Village Green St is a home located in Tulare County with nearby schools including Belleview Elementary School, Bartlett Middle School, and Granite Hills High School.
Ownership History
Date
Name
Owned For
Owner Type
Purchase Details
Closed on
Mar 17, 2020
Sold by
Baird Nancy J
Bought by
Mollo Antonio M and Munn Mollo Rochelle
Current Estimated Value
Home Financials for this Owner
Home Financials are based on the most recent Mortgage that was taken out on this home.
Original Mortgage
$105,000
Interest Rate
3.7%
Mortgage Type
New Conventional
Purchase Details
Closed on
Jan 28, 2020
Sold by
Baird Nacy Jean
Bought by
Mollo Antonio M and Munn Mollo Rochelle Lee
Home Financials for this Owner
Home Financials are based on the most recent Mortgage that was taken out on this home.
Original Mortgage
$105,000
Interest Rate
3.7%
Mortgage Type
New Conventional
Purchase Details
Closed on
Mar 1, 1995
Sold by
Warnke Jay Earl and Warnke James Lee
Bought by
Baird Nancy J
Home Financials for this Owner
Home Financials are based on the most recent Mortgage that was taken out on this home.
Original Mortgage
$31,000
Interest Rate
8.9%
Mortgage Type
Purchase Money Mortgage
Create a Home Valuation Report for This Property
The Home Valuation Report is an in-depth analysis detailing your home's value as well as a comparison with similar homes in the area
Home Values in the Area
Average Home Value in this Area
Purchase History
| Date | Buyer | Sale Price | Title Company |
|---|---|---|---|
| Mollo Antonio M | -- | Chicago Title Company | |
| Mollo Antonio M | $150,000 | Chicago Title Company | |
| Baird Nancy J | $91,000 | First American Title Ins Co | |
| Warnke James Lee | -- | -- | |
| Warnke Jay Earl | -- | -- |
Source: Public Records
Mortgage History
| Date | Status | Borrower | Loan Amount |
|---|---|---|---|
| Previous Owner | Mollo Antonio M | $105,000 | |
| Previous Owner | Baird Nancy J | $31,000 |
Source: Public Records
Tax History Compared to Growth
Tax History
| Year | Tax Paid | Tax Assessment Tax Assessment Total Assessment is a certain percentage of the fair market value that is determined by local assessors to be the total taxable value of land and additions on the property. | Land | Improvement |
|---|---|---|---|---|
| 2025 | $1,742 | $164,043 | $43,743 | $120,300 |
| 2024 | $1,742 | $160,828 | $42,886 | $117,942 |
| 2023 | $1,741 | $157,676 | $42,046 | $115,630 |
| 2022 | $1,687 | $154,585 | $41,222 | $113,363 |
| 2021 | $1,667 | $151,554 | $40,414 | $111,140 |
| 2020 | $1,460 | $139,768 | $46,077 | $93,691 |
| 2019 | $1,432 | $137,028 | $45,174 | $91,854 |
| 2018 | $1,405 | $134,341 | $44,288 | $90,053 |
| 2017 | $1,369 | $131,707 | $43,420 | $88,287 |
| 2016 | $1,312 | $129,125 | $42,569 | $86,556 |
| 2015 | $1,260 | $127,186 | $41,930 | $85,256 |
| 2014 | $1,260 | $124,695 | $41,109 | $83,586 |
Source: Public Records
Map
Nearby Homes
- 824 W Grand Ave
- 816 W Grand Ave
- 670 W Kanai Ave
- 579 N Villa St
- 643 W Belleview Ave
- 572 Memory Ln
- 590 W Morton Ave
- 347 Ohio Cir
- 479 W Grand Ave
- 701 Theta Ave
- 701 W Theta Ave
- 1060 W Belleview Ave
- 293 N Villa St
- 1087 W Belleview Ave
- 474 Douglas St
- 0 W Morton Unit 234694
- 292 N Villa St
- 360 N Capitola Ct Unit 4
- 927 Shadowood Place
- 681 W Mulberry Ave
- 667 Village Green St
- 663 Village Green St
- 746 W Grand Ave
- 659 Village Green St
- 732 W Grand Ave
- 668 Village Green St
- 722 W Grand Ave
- 657 Village Green St
- 649 Village Green St
- 658 Village Green St
- 710 W Grand Ave
- 739 Fairhaven Cir
- 731 Fairhaven Cir
- 725 Fairhaven Cir
- 637 Village Green St
- 650 Village Green St
- 743 W Grand Ave
- 751 W Grand Ave
- 715 Fairhaven Cir
- 737 W Grand Ave