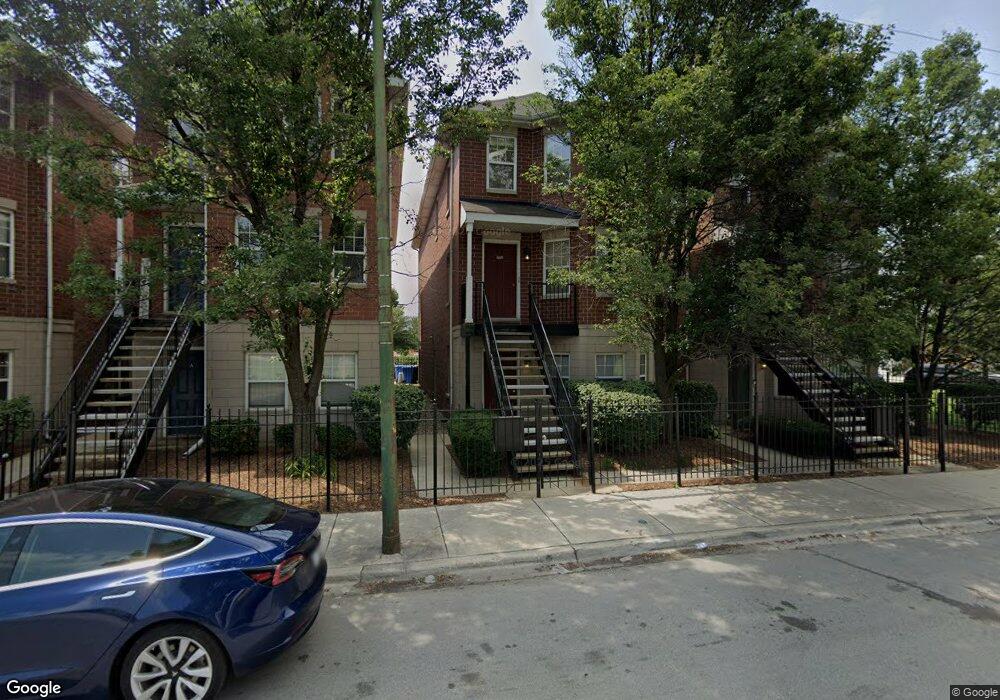
669 W Division St Unit 2A Chicago, IL 60610
Goose Island NeighborhoodEstimated Value: $385,017 - $488,000
--
Bed
--
Bath
--
Sq Ft
3.82
Acres
About This Home
This home is located at 669 W Division St Unit 2A, Chicago, IL 60610 and is currently estimated at $425,504. 669 W Division St Unit 2A is a home located in Cook County with nearby schools including Ogden Elementary School, Lincoln Park High School, and The Noble Academy.
Ownership History
Date
Name
Owned For
Owner Type
Purchase Details
Closed on
Jul 22, 2020
Sold by
Burnside Benjamin J
Bought by
Reed Scott Lawrence
Current Estimated Value
Home Financials for this Owner
Home Financials are based on the most recent Mortgage that was taken out on this home.
Original Mortgage
$308,750
Interest Rate
3%
Mortgage Type
New Conventional
Purchase Details
Closed on
May 26, 2018
Sold by
Pangan Kearney Jon and Pangan Kearney Hyacinth
Bought by
Burnside Benjamin J
Home Financials for this Owner
Home Financials are based on the most recent Mortgage that was taken out on this home.
Original Mortgage
$265,000
Interest Rate
4.75%
Mortgage Type
New Conventional
Purchase Details
Closed on
Jul 28, 2004
Sold by
Division & Crosby Llc
Bought by
Kearney Jon
Home Financials for this Owner
Home Financials are based on the most recent Mortgage that was taken out on this home.
Original Mortgage
$224,454
Interest Rate
3.73%
Mortgage Type
Purchase Money Mortgage
Create a Home Valuation Report for This Property
The Home Valuation Report is an in-depth analysis detailing your home's value as well as a comparison with similar homes in the area
Home Values in the Area
Average Home Value in this Area
Purchase History
| Date | Buyer | Sale Price | Title Company |
|---|---|---|---|
| Reed Scott Lawrence | $325,000 | First American Title | |
| Burnside Benjamin J | $295,000 | Attorney | |
| Kearney Jon | $217,000 | Cti |
Source: Public Records
Mortgage History
| Date | Status | Borrower | Loan Amount |
|---|---|---|---|
| Previous Owner | Reed Scott Lawrence | $308,750 | |
| Previous Owner | Burnside Benjamin J | $265,000 | |
| Previous Owner | Kearney Jon | $224,454 |
Source: Public Records
Tax History Compared to Growth
Tax History
| Year | Tax Paid | Tax Assessment Tax Assessment Total Assessment is a certain percentage of the fair market value that is determined by local assessors to be the total taxable value of land and additions on the property. | Land | Improvement |
|---|---|---|---|---|
| 2024 | $6,111 | $29,546 | $18,294 | $11,252 |
| 2023 | $5,957 | $28,965 | $14,753 | $14,212 |
| 2022 | $5,957 | $28,965 | $14,753 | $14,212 |
| 2021 | $5,824 | $28,964 | $14,753 | $14,211 |
| 2020 | $5,126 | $23,012 | $14,163 | $8,849 |
| 2019 | $5,041 | $25,092 | $14,163 | $10,929 |
| 2018 | $4,956 | $25,092 | $14,163 | $10,929 |
| 2017 | $3,542 | $16,453 | $11,212 | $5,241 |
| 2016 | $3,295 | $16,453 | $11,212 | $5,241 |
| 2015 | $3,015 | $16,453 | $11,212 | $5,241 |
| 2014 | $2,460 | $13,261 | $8,497 | $4,764 |
| 2013 | $2,412 | $13,261 | $8,497 | $4,764 |
Source: Public Records
Map
Nearby Homes
- 1036 N Crosby St
- 1333 N Burling St Unit B
- 1317 N Larrabee St Unit 305
- 1317 N Larrabee St Unit 304
- 511 W Division St Unit 607
- 1014 N Larrabee St Unit 4N
- 1010 N Crosby St
- 634 W Oak St Unit 9
- 1009 N Riverwalk St
- 954 N Crosby St Unit 954C
- 1000 N Kingsbury St Unit 304
- 1329 N Mohawk St Unit 1
- 1310 N Cleveland Ave Unit 3
- 900 N Kingsbury St Unit 777
- 900 N Kingsbury St Unit 718
- 900 N Kingsbury St Unit 835
- 900 N Kingsbury St Unit 1025
- 900 N Kingsbury St Unit 716
- 925 N Larrabee St Unit 4S
- 906 N Larrabee St Unit A
- 669 W Division St Unit A
- 669 W Division St Unit 2C
- 669 W Division St Unit 2B
- 671 W Division St Unit 1C
- 671 W Division St Unit 1B
- 671 W Division St Unit 1A
- 671 W Division St Unit A
- 671 W Division St Unit C
- 667 W Division St Unit 3C
- 667 W Division St Unit 3B
- 667 W Division St Unit 3A
- 667 W Division St Unit B
- 665 W Division St Unit B
- 665 W Division St Unit 4C
- 665 W Division St Unit 4B
- 665 W Division St Unit 4A
- 665 W Division St Unit 3C
- 663 W Division St Unit A
- 663 W Division St Unit 5C
- 663 W Division St Unit 5B