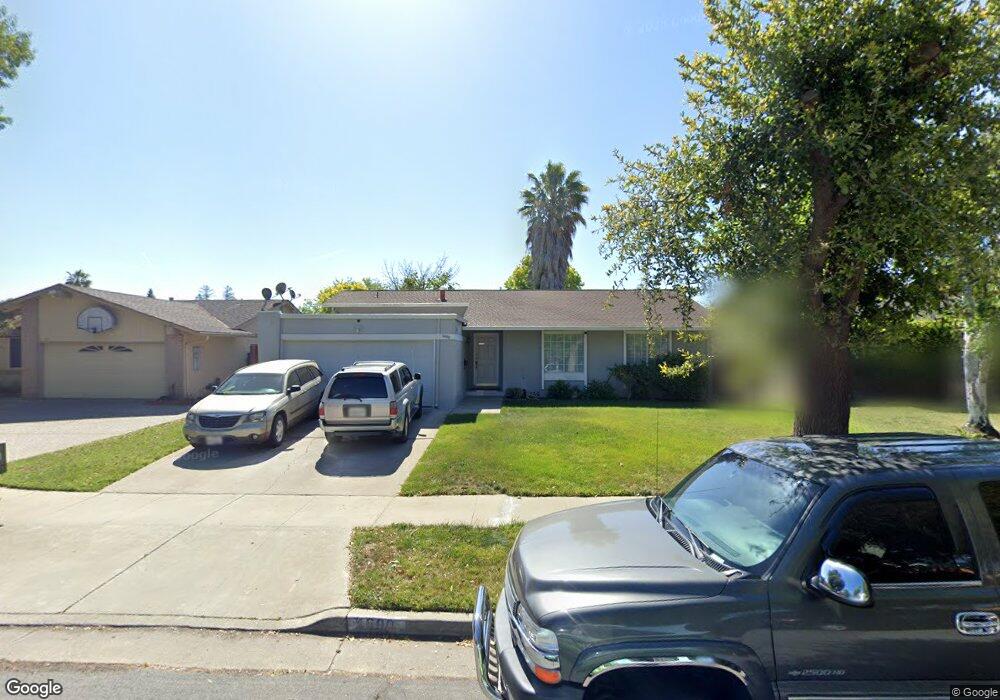
6690 Catamaran St San Jose, CA 95119
Rancho Santa Teresa NeighborhoodEstimated Value: $1,398,455 - $1,547,000
4
Beds
2
Baths
1,495
Sq Ft
$971/Sq Ft
Est. Value
About This Home
This home is located at 6690 Catamaran St, San Jose, CA 95119 and is currently estimated at $1,452,114, approximately $971 per square foot. 6690 Catamaran St is a home located in Santa Clara County with nearby schools including Baldwin (Julia) Elementary School, Bernal Intermediate School, and Santa Teresa High School.
Ownership History
Date
Name
Owned For
Owner Type
Purchase Details
Closed on
Dec 20, 2006
Sold by
Ramaker James
Bought by
Clausen Peter M and Clausen Lillian E
Current Estimated Value
Purchase Details
Closed on
Jun 6, 2005
Sold by
Wood Julie
Bought by
Ramaker James
Home Financials for this Owner
Home Financials are based on the most recent Mortgage that was taken out on this home.
Original Mortgage
$235,100
Interest Rate
5.72%
Mortgage Type
New Conventional
Purchase Details
Closed on
Oct 4, 1999
Sold by
Province Tracey A
Bought by
Ramaker James and Wood Julie
Home Financials for this Owner
Home Financials are based on the most recent Mortgage that was taken out on this home.
Original Mortgage
$313,750
Interest Rate
7.77%
Purchase Details
Closed on
Feb 10, 1997
Sold by
Richard Benjestorf
Bought by
Province Tracey A
Home Financials for this Owner
Home Financials are based on the most recent Mortgage that was taken out on this home.
Original Mortgage
$238,500
Interest Rate
7%
Create a Home Valuation Report for This Property
The Home Valuation Report is an in-depth analysis detailing your home's value as well as a comparison with similar homes in the area
Home Values in the Area
Average Home Value in this Area
Purchase History
| Date | Buyer | Sale Price | Title Company |
|---|---|---|---|
| Clausen Peter M | $680,000 | Financial Title Company | |
| Ramaker James | -- | Fidelity National Title Ins | |
| Ramaker James | $392,500 | Fidelity National Title Co | |
| Province Tracey A | $265,000 | North American Title Co |
Source: Public Records
Mortgage History
| Date | Status | Borrower | Loan Amount |
|---|---|---|---|
| Previous Owner | Ramaker James | $235,100 | |
| Previous Owner | Ramaker James | $313,750 | |
| Previous Owner | Province Tracey A | $238,500 |
Source: Public Records
Tax History Compared to Growth
Tax History
| Year | Tax Paid | Tax Assessment Tax Assessment Total Assessment is a certain percentage of the fair market value that is determined by local assessors to be the total taxable value of land and additions on the property. | Land | Improvement |
|---|---|---|---|---|
| 2025 | $12,638 | $911,038 | $637,733 | $273,305 |
| 2024 | $12,638 | $893,176 | $625,229 | $267,947 |
| 2023 | $12,450 | $875,664 | $612,970 | $262,694 |
| 2022 | $12,376 | $858,495 | $600,951 | $257,544 |
| 2021 | $12,205 | $841,663 | $589,168 | $252,495 |
| 2020 | $11,947 | $833,033 | $583,127 | $249,906 |
| 2019 | $11,674 | $816,700 | $571,694 | $245,006 |
| 2018 | $11,600 | $800,687 | $560,485 | $240,202 |
| 2017 | $11,448 | $784,989 | $549,496 | $235,493 |
| 2016 | $10,895 | $769,598 | $538,722 | $230,876 |
| 2015 | $9,531 | $669,300 | $468,500 | $200,800 |
| 2014 | $8,240 | $614,000 | $429,800 | $184,200 |
Source: Public Records
Map
Nearby Homes
- 201 Bahia Ct
- 6624 Catamaran St
- 6579 Prague Ct
- 237 Arbor Valley Dr
- 213 Purple Glen Dr
- 227 Martinvale Ln
- 6554 Catamaran St
- 203 Pemba Ct
- 273 Jaggers Dr
- 321 Vineyard Dr
- 180 Kona Place
- 207 New River Dr
- 277 Dondero Way
- 6375 San Anselmo Way
- 299 Moraga Way
- 6362 San Anselmo Way
- 219 Fairway Glen Ln
- 246 Castillon Way
- 6681 Optimum Loop
- 6689 Optimum Loop
- 6694 Catamaran St
- 6686 Catamaran St
- 6721 Cielito Way
- 6717 Cielito Way
- 6725 Cielito Way
- 6734 Altiplano Way
- 6682 Catamaran St
- 6675 Catamaran St
- 6740 Altiplano Way
- 6711 Cielito Way
- 6720 Altiplano Way
- 6748 Altiplano Way
- 6678 Catamaran St
- 6671 Catamaran St
- 6707 Cielito Way
- 6674 Catamaran St
- 6714 Altiplano Way
- 6703 Cielito Way
- 6722 Cielito Way
- 6718 Cielito Way