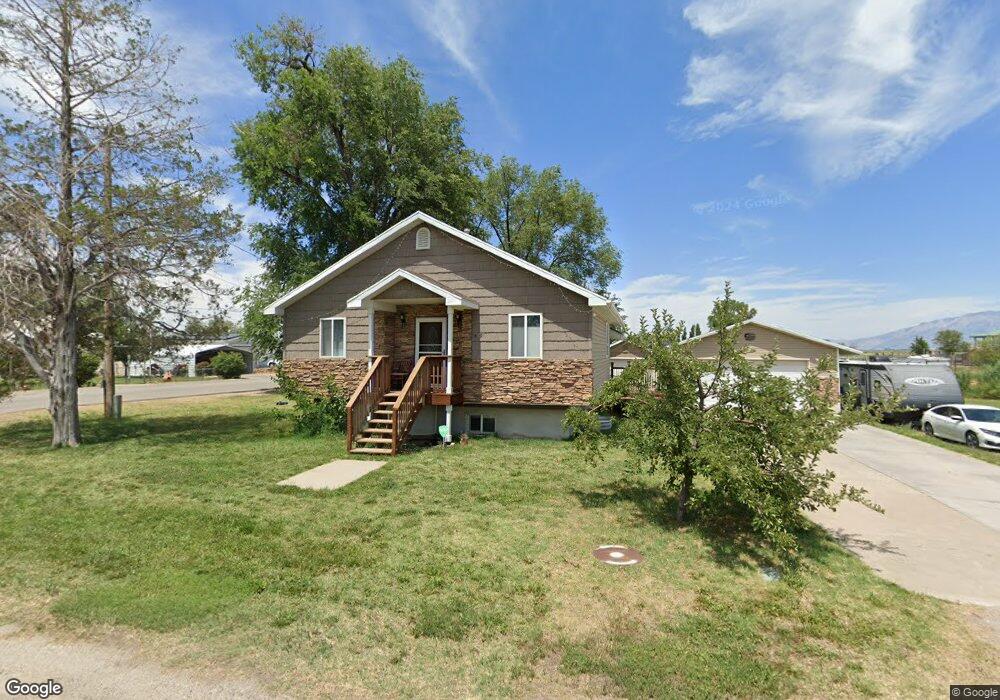
6690 W 4600 S Hooper, UT 84315
Estimated Value: $523,000 - $661,000
4
Beds
2
Baths
2,512
Sq Ft
$237/Sq Ft
Est. Value
About This Home
This home is located at 6690 W 4600 S, Hooper, UT 84315 and is currently estimated at $595,225, approximately $236 per square foot. 6690 W 4600 S is a home located in Weber County with nearby schools including Hooper School, Rocky Mountain Junior High School, and Fremont High School.
Ownership History
Date
Name
Owned For
Owner Type
Purchase Details
Closed on
Oct 1, 2008
Sold by
Turner Shane K
Bought by
Toombs Jason R and Toombs Letitia J
Current Estimated Value
Home Financials for this Owner
Home Financials are based on the most recent Mortgage that was taken out on this home.
Original Mortgage
$199,192
Interest Rate
6.43%
Mortgage Type
VA
Purchase Details
Closed on
Mar 17, 2005
Sold by
Richardson Charma
Bought by
Turner Shane K
Home Financials for this Owner
Home Financials are based on the most recent Mortgage that was taken out on this home.
Original Mortgage
$156,000
Interest Rate
5.6%
Mortgage Type
Construction
Purchase Details
Closed on
Jul 29, 2004
Sold by
Washington Mutual Bank Fa
Bought by
Richardson Charma
Home Financials for this Owner
Home Financials are based on the most recent Mortgage that was taken out on this home.
Original Mortgage
$45,000
Interest Rate
5.95%
Mortgage Type
Purchase Money Mortgage
Purchase Details
Closed on
Apr 23, 2004
Sold by
Chase Manhattan Mortgage Corp
Bought by
Washington Mutual Bank Fa
Purchase Details
Closed on
Apr 14, 2004
Sold by
Federal National Mortgage Association
Bought by
Chase Manhattan Mortgage Corp
Purchase Details
Closed on
Sep 26, 2001
Sold by
Hud
Bought by
Utah Housing Corp and Utah Housing Finance Agency
Purchase Details
Closed on
Nov 6, 1999
Sold by
Roth Terrance and Roth Patricia
Bought by
Lewis Rex L and Lewis Janelle M
Home Financials for this Owner
Home Financials are based on the most recent Mortgage that was taken out on this home.
Original Mortgage
$93,000
Interest Rate
7.75%
Mortgage Type
Seller Take Back
Create a Home Valuation Report for This Property
The Home Valuation Report is an in-depth analysis detailing your home's value as well as a comparison with similar homes in the area
Home Values in the Area
Average Home Value in this Area
Purchase History
Date | Buyer | Sale Price | Title Company |
---|---|---|---|
Toombs Jason R | -- | Executive Title Ogden | |
Turner Shane K | -- | First American Title | |
Richardson Charma | -- | First American Title | |
Washington Mutual Bank Fa | -- | Backman Stewart Title | |
Chase Manhattan Mortgage Corp | -- | Backman Stewart Title | |
Utah Housing Corp | -- | -- | |
Lewis Rex L | -- | -- |
Source: Public Records
Mortgage History
Date | Status | Borrower | Loan Amount |
---|---|---|---|
Closed | Toombs Jason R | $315,628 | |
Closed | Toombs Jason R | $314,944 | |
Closed | Toombs Jason R | $224,500 | |
Closed | Toombs Jason R | $240,000 | |
Closed | Toombs Jason R | $194,166 | |
Closed | Toombs Jason R | $206,025 | |
Closed | Toombs Jason R | $20,000 | |
Closed | Toombs Jason R | $199,192 | |
Previous Owner | Turner Shane K | $216,000 | |
Previous Owner | Turner Shane K | $54,000 | |
Previous Owner | Turner Shane K | $200,000 | |
Previous Owner | Turner Shane K | $50,000 | |
Previous Owner | Turner Shane K | $156,000 | |
Previous Owner | Richardson Charma | $45,000 | |
Previous Owner | Lewis Rex L | $93,000 |
Source: Public Records
Tax History Compared to Growth
Tax History
Year | Tax Paid | Tax Assessment Tax Assessment Total Assessment is a certain percentage of the fair market value that is determined by local assessors to be the total taxable value of land and additions on the property. | Land | Improvement |
---|---|---|---|---|
2024 | $3,245 | $316,931 | $128,180 | $188,751 |
2023 | $3,002 | $290,541 | $117,252 | $173,289 |
2022 | $3,124 | $300,849 | $92,538 | $208,311 |
2021 | $2,675 | $433,997 | $129,600 | $304,397 |
2020 | $2,632 | $390,000 | $94,600 | $295,400 |
2019 | $2,513 | $350,999 | $74,664 | $276,335 |
2018 | $2,432 | $324,000 | $69,637 | $254,363 |
2017 | $2,309 | $299,998 | $65,981 | $234,017 |
2016 | $2,141 | $154,776 | $39,550 | $115,226 |
2015 | $2,043 | $145,487 | $35,748 | $109,739 |
2014 | $1,982 | $137,312 | $41,050 | $96,262 |
Source: Public Records
Map
Nearby Homes