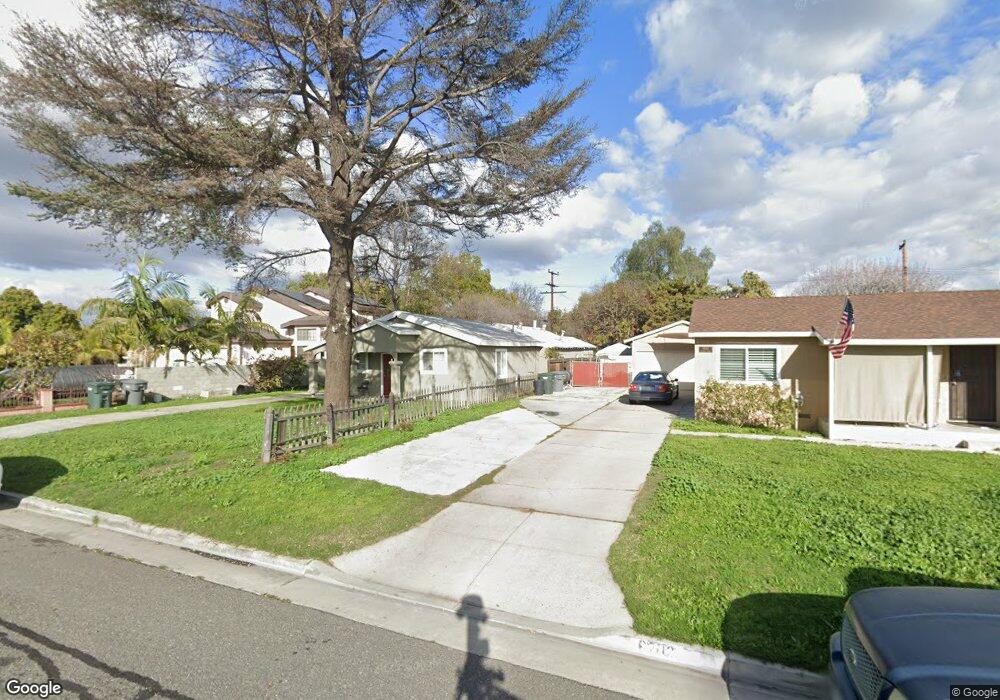
6692 Burnham Ave Buena Park, CA 90621
Estimated Value: $851,000 - $1,035,000
3
Beds
1
Bath
1,558
Sq Ft
$584/Sq Ft
Est. Value
About This Home
This home is located at 6692 Burnham Ave, Buena Park, CA 90621 and is currently estimated at $909,246, approximately $583 per square foot. 6692 Burnham Ave is a home located in Orange County with nearby schools including Carl E. Gilbert Elementary School, Buena Park Junior High School, and Buena Park High School.
Ownership History
Date
Name
Owned For
Owner Type
Purchase Details
Closed on
May 20, 2004
Sold by
Ayeni Patience I
Bought by
Biosah Destiny Valentine and Biosah Patience I
Current Estimated Value
Purchase Details
Closed on
Jul 21, 1999
Sold by
Va
Bought by
Dillard Michael L
Home Financials for this Owner
Home Financials are based on the most recent Mortgage that was taken out on this home.
Original Mortgage
$177,025
Interest Rate
7.97%
Purchase Details
Closed on
Jul 7, 1999
Sold by
Dillard Michael L
Bought by
Ayeni Patience I
Home Financials for this Owner
Home Financials are based on the most recent Mortgage that was taken out on this home.
Original Mortgage
$177,025
Interest Rate
7.97%
Purchase Details
Closed on
Aug 9, 1994
Sold by
Everett William L and Everett Eileen
Bought by
Va
Create a Home Valuation Report for This Property
The Home Valuation Report is an in-depth analysis detailing your home's value as well as a comparison with similar homes in the area
Home Values in the Area
Average Home Value in this Area
Purchase History
| Date | Buyer | Sale Price | Title Company |
|---|---|---|---|
| Biosah Destiny Valentine | -- | -- | |
| Dillard Michael L | -- | Landsafe Title | |
| Ayeni Patience I | $182,500 | Landsafe Title | |
| Va | $105,000 | Landwood Title Company |
Source: Public Records
Mortgage History
| Date | Status | Borrower | Loan Amount |
|---|---|---|---|
| Previous Owner | Ayeni Patience I | $177,025 | |
| Closed | Ayeni Patience I | $5,475 |
Source: Public Records
Tax History Compared to Growth
Tax History
| Year | Tax Paid | Tax Assessment Tax Assessment Total Assessment is a certain percentage of the fair market value that is determined by local assessors to be the total taxable value of land and additions on the property. | Land | Improvement |
|---|---|---|---|---|
| 2025 | $3,364 | $280,487 | $179,671 | $100,816 |
| 2024 | $3,364 | $274,988 | $176,148 | $98,840 |
| 2023 | $3,293 | $269,597 | $172,695 | $96,902 |
| 2022 | $3,238 | $264,311 | $169,309 | $95,002 |
| 2021 | $3,214 | $259,129 | $165,989 | $93,140 |
| 2020 | $3,175 | $256,472 | $164,287 | $92,185 |
| 2019 | $3,103 | $251,444 | $161,066 | $90,378 |
| 2018 | $3,044 | $246,514 | $157,908 | $88,606 |
| 2017 | $3,002 | $241,681 | $154,812 | $86,869 |
| 2016 | $2,943 | $236,943 | $151,777 | $85,166 |
| 2015 | $2,820 | $233,384 | $149,497 | $83,887 |
| 2014 | $2,808 | $228,813 | $146,569 | $82,244 |
Source: Public Records
Map
Nearby Homes
- 6482 Western Ave
- 7579 Melrose St
- 6493 Kingman Ave
- 7261 9th St
- 6411 Western Ave
- 7692 9th St Unit 112
- 7692 9th St Unit 116
- 7692 9th St Unit 117
- 7692 9th St Unit 115
- 7515 8th St
- 7791 Melrose St
- 7051 9th St
- 6296 Beach Blvd
- 7142 Orangethorpe Ave Unit 8D
- 7541 5th St
- 6302 Homewood Ave
- 6362 Darlington Ave
- 7911 Orangethorpe Ave
- 7451 Western Ave
- 6041 Fullerton Ave
- 6682 Burnham Ave
- 6702 Burnham Ave
- 6676 Burnham Ave
- 6722 Burnham Ave
- 6691 Western Ave
- 6701 Western Ave
- 6681 Western Ave
- 6672 Burnham Ave
- 6732 Burnham Ave
- 6675 Western Ave
- 6711 Western Ave
- 6691 Burnham Ave
- 6701 Burnham Ave
- 6681 Burnham Ave
- 6662 Burnham Ave
- 6671 Western Ave
- 6721 Western Ave
- 6711 Burnham Ave
- 6742 Burnham Ave
- 6675 Burnham Ave