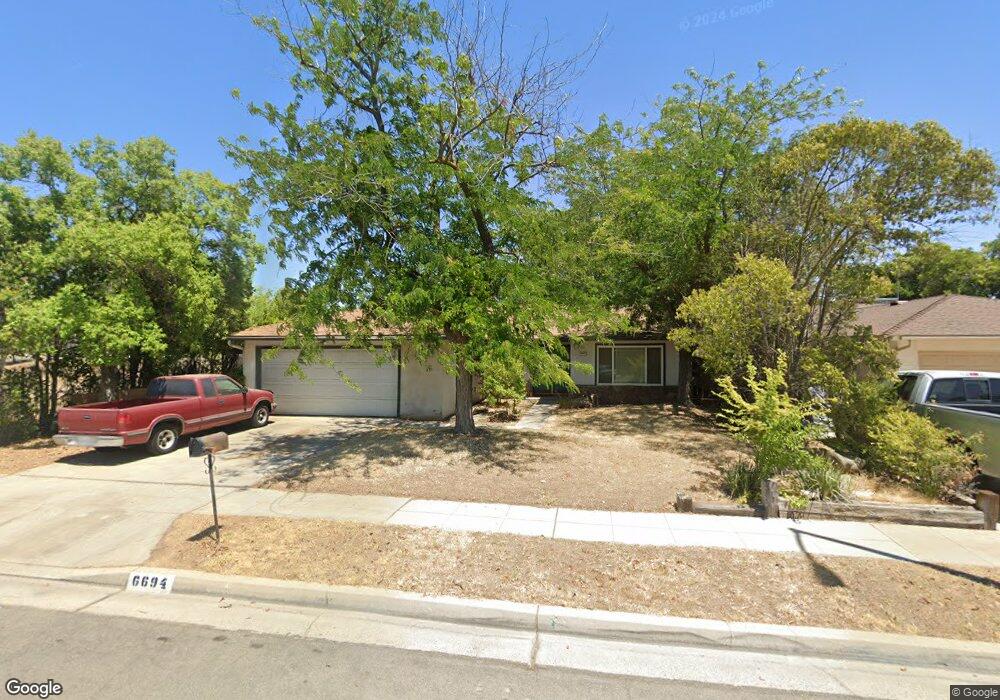
6694 N Nantucket Ave Fresno, CA 93704
Bullard NeighborhoodEstimated Value: $415,135 - $492,000
3
Beds
2
Baths
1,866
Sq Ft
$245/Sq Ft
Est. Value
About This Home
This home is located at 6694 N Nantucket Ave, Fresno, CA 93704 and is currently estimated at $457,284, approximately $245 per square foot. 6694 N Nantucket Ave is a home located in Fresno County with nearby schools including Kratt Elementary School, Tenaya Middle School, and Bullard High School.
Ownership History
Date
Name
Owned For
Owner Type
Purchase Details
Closed on
Dec 22, 2009
Sold by
Simpson Maria O
Bought by
Simpson James C
Current Estimated Value
Purchase Details
Closed on
Nov 10, 2002
Sold by
Miranda Suzanne
Bought by
Simpson Walter W and Simpson Maria O
Home Financials for this Owner
Home Financials are based on the most recent Mortgage that was taken out on this home.
Original Mortgage
$86,750
Outstanding Balance
$36,148
Interest Rate
5.95%
Estimated Equity
$421,136
Purchase Details
Closed on
Jun 27, 2002
Sold by
Miranda Raymond and Miranda Suzanne
Bought by
Miranda Suzanne
Purchase Details
Closed on
Jan 11, 1995
Sold by
Millar Ronald D and Millar Kristen R
Bought by
Miranda Raymond and Miranda Suzanne
Home Financials for this Owner
Home Financials are based on the most recent Mortgage that was taken out on this home.
Original Mortgage
$124,745
Interest Rate
7.88%
Mortgage Type
FHA
Create a Home Valuation Report for This Property
The Home Valuation Report is an in-depth analysis detailing your home's value as well as a comparison with similar homes in the area
Home Values in the Area
Average Home Value in this Area
Purchase History
| Date | Buyer | Sale Price | Title Company |
|---|---|---|---|
| Simpson James C | -- | None Available | |
| Simpson Walter W | $173,500 | First American Title Ins Co | |
| Miranda Suzanne | -- | First American Title Ins Co | |
| Miranda Raymond | $126,000 | Chicago Title Co |
Source: Public Records
Mortgage History
| Date | Status | Borrower | Loan Amount |
|---|---|---|---|
| Open | Simpson Walter W | $86,750 | |
| Previous Owner | Miranda Raymond | $124,745 |
Source: Public Records
Tax History Compared to Growth
Tax History
| Year | Tax Paid | Tax Assessment Tax Assessment Total Assessment is a certain percentage of the fair market value that is determined by local assessors to be the total taxable value of land and additions on the property. | Land | Improvement |
|---|---|---|---|---|
| 2025 | $2,737 | $225,882 | $58,081 | $167,801 |
| 2023 | $2,683 | $217,113 | $55,827 | $161,286 |
| 2022 | $2,645 | $212,857 | $54,733 | $158,124 |
| 2021 | $2,571 | $208,684 | $53,660 | $155,024 |
| 2020 | $2,559 | $206,545 | $53,110 | $153,435 |
| 2019 | $2,458 | $202,496 | $52,069 | $150,427 |
| 2018 | $2,404 | $198,527 | $51,049 | $147,478 |
| 2017 | $2,361 | $194,636 | $50,049 | $144,587 |
| 2016 | $2,281 | $190,820 | $49,068 | $141,752 |
| 2015 | $2,245 | $187,954 | $48,331 | $139,623 |
| 2014 | $2,202 | $184,273 | $47,385 | $136,888 |
Source: Public Records
Map
Nearby Homes
- 6607 N Maroa Ave
- 353 W Warner Ave
- 7013 N Maroa Ave
- 221 W Herndon Ave Unit 130
- 221 W Herndon Ave Unit 49
- 221 W Herndon Ave Unit 87
- 221 W Herndon Ave Unit 66
- 221 W Herndon Ave Unit 37
- 221 W Herndon Ave Unit 50
- 221 W Herndon Ave Unit 71
- 221 W Herndon Ave Unit 59
- 221 W Herndon Ave Unit 132
- 221 W Herndon Ave Unit 27
- 375 W Fir Ave
- 6548 N Poplar Ave
- 355 W Sierra Ave Unit 106
- 6338 N Maroa Ave Unit 115
- 744 W Magill Ave
- 744 W Palo Altp Ave
- 317 W Sierra Ave Unit 124
- 6682 N Nantucket Ave
- 6693 N Maroa Ave
- 6676 N Nantucket Ave
- 6681 N Maroa Ave
- 6675 N Maroa Ave
- 6695 N Nantucket Ave
- 6683 N Nantucket Ave
- 6664 N Nantucket Ave
- 6677 N Nantucket Ave
- 6663 N Nantucket Ave
- 6680 N Winchester Ave
- 6694 N Maroa Ave Unit 233
- 6674 N Winchester Ave
- 6655 N Nantucket Ave
- 6662 N Winchester Ave
- 6643 N Maroa Ave
- 6682 N Winchester Ave
- 6643 N Nantucket Ave
- 6650 N Maroa Ave Unit 217
- 6650 N Maroa Ave Unit 218