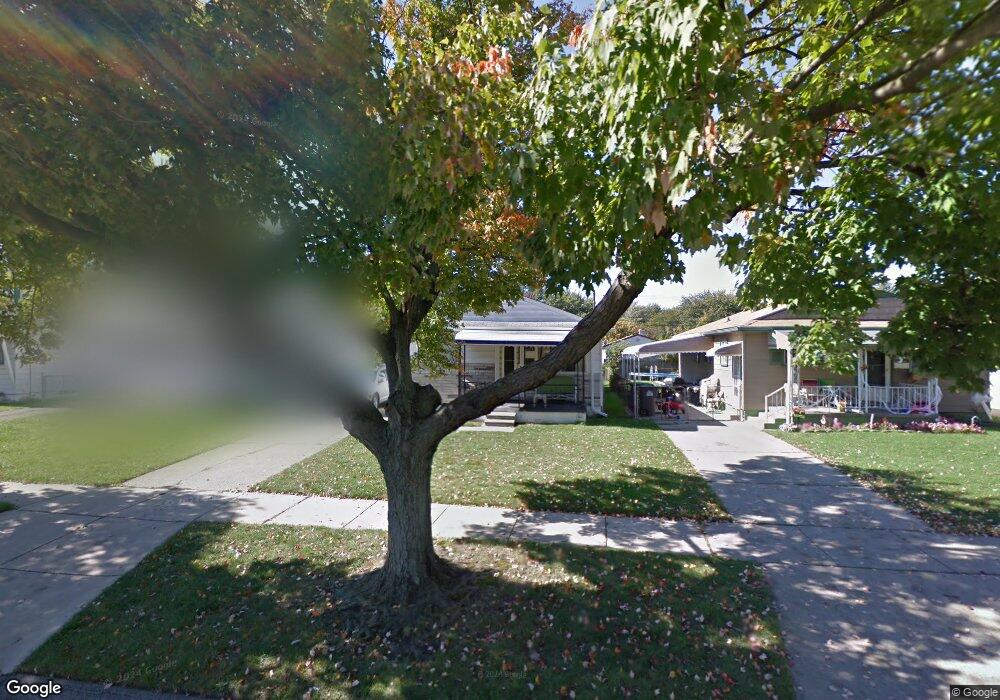
6696 Pine St Taylor, MI 48180
Estimated Value: $115,000 - $157,000
Studio
--
Bath
852
Sq Ft
$152/Sq Ft
Est. Value
About This Home
This home is located at 6696 Pine St, Taylor, MI 48180 and is currently estimated at $129,361, approximately $151 per square foot. 6696 Pine St is a home located in Wayne County with nearby schools including Clarence Randall Elementary School, Hoover Middle School, and Quest Charter Academy.
Ownership History
Date
Name
Owned For
Owner Type
Purchase Details
Closed on
Jun 12, 2022
Sold by
Adams and Ava
Bought by
White John Gerald
Current Estimated Value
Purchase Details
Closed on
Jul 31, 2013
Sold by
Adams Danny and Adams Vivian
Bought by
Hess Carter C
Purchase Details
Closed on
Mar 8, 2013
Sold by
Hess Carter C
Bought by
Adams Danny and Adams Ava
Purchase Details
Closed on
Apr 18, 2002
Sold by
Adams Vivian and Adams Elmer
Bought by
Adams Vivian
Create a Home Valuation Report for This Property
The Home Valuation Report is an in-depth analysis detailing your home's value as well as a comparison with similar homes in the area
Home Values in the Area
Average Home Value in this Area
Purchase History
| Date | Buyer | Sale Price | Title Company |
|---|---|---|---|
| White John Gerald | $60,000 | None Listed On Document | |
| Hess Carter C | -- | None Available | |
| Adams Danny | -- | Speck Aaron T | |
| Adams Danny | -- | Speck Aaron T | |
| Adams Vivian | -- | None Available |
Source: Public Records
Tax History
| Year | Tax Paid | Tax Assessment Tax Assessment Total Assessment is a certain percentage of the fair market value that is determined by local assessors to be the total taxable value of land and additions on the property. | Land | Improvement |
|---|---|---|---|---|
| 2025 | $2,842 | $62,700 | $0 | $0 |
| 2024 | $2,759 | $45,000 | $0 | $0 |
| 2023 | $3,530 | $48,900 | $0 | $0 |
| 2022 | $1,149 | $43,200 | $0 | $0 |
| 2021 | $1,269 | $39,000 | $0 | $0 |
| 2020 | $1,257 | $35,300 | $0 | $0 |
| 2019 | $125,606 | $29,000 | $0 | $0 |
| 2018 | $987 | $23,600 | $0 | $0 |
| 2017 | $546 | $24,100 | $0 | $0 |
| 2016 | $1,227 | $23,400 | $0 | $0 |
| 2015 | $2,230 | $22,300 | $0 | $0 |
| 2013 | $2,350 | $23,500 | $0 | $0 |
| 2012 | $1,004 | $22,900 | $7,300 | $15,600 |
Source: Public Records
Map
Nearby Homes
- 6688 Madison St
- 6753 Madison St
- 6587 Elm St
- 6606 Cornell St
- 6864 Cornell St
- 6456 Birch St
- 6784 Cooper St
- 7166 Pardee Rd
- 6550 Buck St
- 6605 Bailey St
- 7912 Pine St
- 6420 Burr St
- 6469 Troy St
- 5871 Cooper St
- 5689 Cornell St
- 8210 Westpoint St
- 8279 Elm St
- 5578 Grindley Park St
- 22931 Champaign St
- 8303 Birch St
Your Personal Tour Guide
Ask me questions while you tour the home.