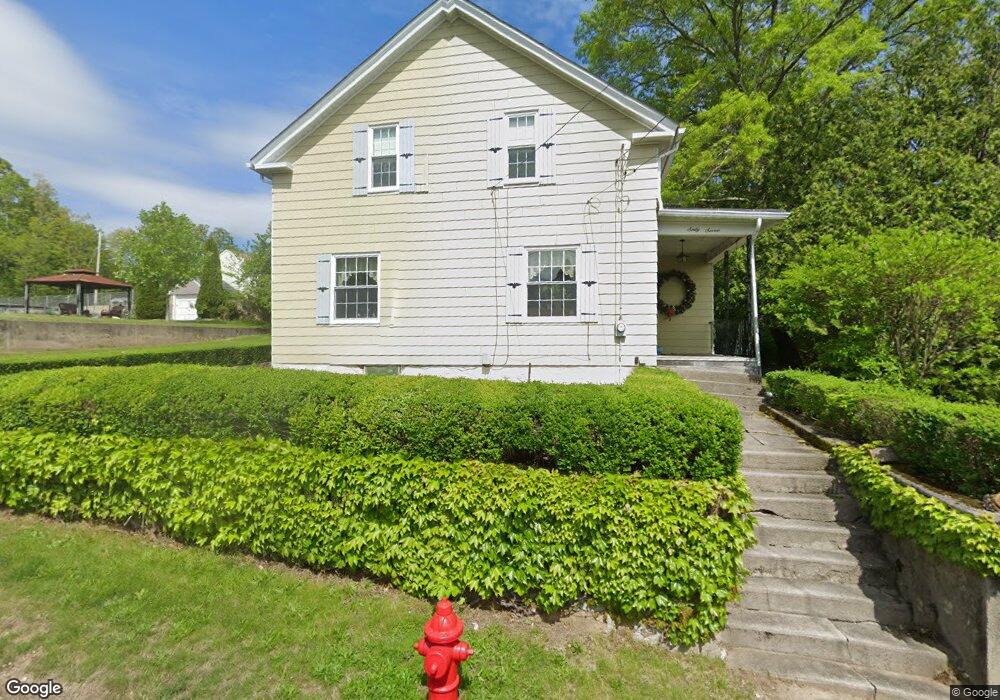
67 Aberdeen St West Warwick, RI 02893
Lippitt-Harris NeighborhoodEstimated Value: $278,000 - $371,000
3
Beds
1
Bath
1,364
Sq Ft
$249/Sq Ft
Est. Value
About This Home
This home is located at 67 Aberdeen St, West Warwick, RI 02893 and is currently estimated at $339,367, approximately $248 per square foot. 67 Aberdeen St is a home located in Kent County with nearby schools including West Warwick High School, St Joseph School, and Islamic School of Rhode Island.
Ownership History
Date
Name
Owned For
Owner Type
Purchase Details
Closed on
Sep 5, 2025
Sold by
Latter Ft and Laiter
Bought by
Amc Properties Llc
Current Estimated Value
Home Financials for this Owner
Home Financials are based on the most recent Mortgage that was taken out on this home.
Original Mortgage
$280,000
Outstanding Balance
$279,505
Interest Rate
6.63%
Mortgage Type
New Conventional
Estimated Equity
$59,862
Purchase Details
Closed on
Jul 10, 2024
Sold by
Laiter Frank D and Laiter Shirley D
Bought by
Laiter Ft and Laiter
Create a Home Valuation Report for This Property
The Home Valuation Report is an in-depth analysis detailing your home's value as well as a comparison with similar homes in the area
Home Values in the Area
Average Home Value in this Area
Purchase History
| Date | Buyer | Sale Price | Title Company |
|---|---|---|---|
| Amc Properties Llc | $280,000 | -- | |
| Amc Properties Llc | $280,000 | -- | |
| Laiter Ft | -- | None Available | |
| Laiter Ft | -- | None Available | |
| Laiter Ft | -- | None Available |
Source: Public Records
Mortgage History
| Date | Status | Borrower | Loan Amount |
|---|---|---|---|
| Open | Amc Properties Llc | $280,000 | |
| Closed | Amc Properties Llc | $280,000 |
Source: Public Records
Tax History Compared to Growth
Tax History
| Year | Tax Paid | Tax Assessment Tax Assessment Total Assessment is a certain percentage of the fair market value that is determined by local assessors to be the total taxable value of land and additions on the property. | Land | Improvement |
|---|---|---|---|---|
| 2025 | $3,855 | $269,800 | $65,200 | $204,600 |
| 2024 | $4,215 | $225,500 | $52,200 | $173,300 |
| 2023 | $4,131 | $225,500 | $52,200 | $173,300 |
| 2022 | $4,068 | $225,500 | $52,200 | $173,300 |
| 2021 | $3,841 | $167,000 | $52,200 | $114,800 |
| 2020 | $3,841 | $167,000 | $52,200 | $114,800 |
| 2019 | $4,896 | $167,000 | $52,200 | $114,800 |
| 2018 | $3,088 | $126,500 | $52,200 | $74,300 |
| 2017 | $3,328 | $126,500 | $52,200 | $74,300 |
| 2016 | $3,269 | $126,500 | $52,200 | $74,300 |
| 2015 | $3,076 | $118,500 | $52,200 | $66,300 |
| 2014 | $3,009 | $118,500 | $52,200 | $66,300 |
Source: Public Records
Map
Nearby Homes