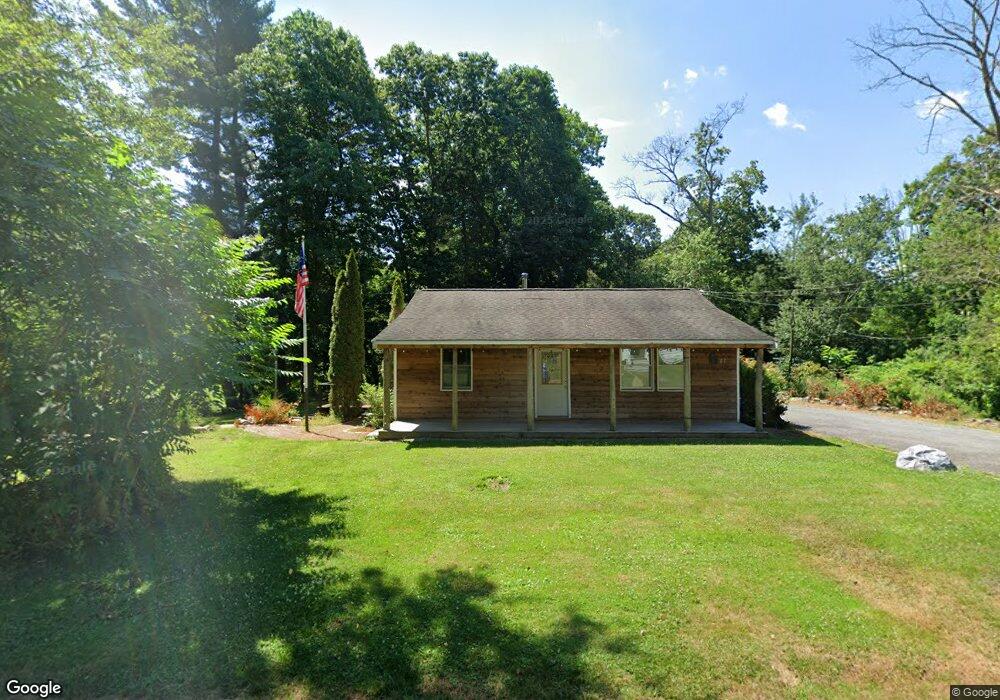
67 Allen St East Bridgewater, MA 02333
Estimated Value: $382,000 - $462,000
2
Beds
2
Baths
792
Sq Ft
$542/Sq Ft
Est. Value
About This Home
This home is located at 67 Allen St, East Bridgewater, MA 02333 and is currently estimated at $429,226, approximately $541 per square foot. 67 Allen St is a home located in Plymouth County with nearby schools including Central Elementary School, Gordon W Mitchell Middle School, and East Bridgewater Jr./Sr. High School.
Ownership History
Date
Name
Owned For
Owner Type
Purchase Details
Closed on
Jul 19, 1999
Sold by
Associates Home Equity
Bought by
Finn Edward F
Current Estimated Value
Purchase Details
Closed on
Nov 12, 1998
Sold by
Associates Home Equity and Jacobson Judith E
Bought by
Associates Home Equity
Create a Home Valuation Report for This Property
The Home Valuation Report is an in-depth analysis detailing your home's value as well as a comparison with similar homes in the area
Home Values in the Area
Average Home Value in this Area
Purchase History
| Date | Buyer | Sale Price | Title Company |
|---|---|---|---|
| Finn Edward F | $75,000 | -- | |
| Associates Home Equity | $58,000 | -- |
Source: Public Records
Mortgage History
| Date | Status | Borrower | Loan Amount |
|---|---|---|---|
| Open | Associates Home Equity | $127,000 | |
| Closed | Associates Home Equity | $132,000 |
Source: Public Records
Tax History Compared to Growth
Tax History
| Year | Tax Paid | Tax Assessment Tax Assessment Total Assessment is a certain percentage of the fair market value that is determined by local assessors to be the total taxable value of land and additions on the property. | Land | Improvement |
|---|---|---|---|---|
| 2025 | $5,386 | $394,000 | $176,100 | $217,900 |
| 2024 | $5,279 | $381,400 | $169,300 | $212,100 |
| 2023 | $5,227 | $361,700 | $169,300 | $192,400 |
| 2022 | $5,279 | $338,400 | $154,000 | $184,400 |
| 2021 | $5,054 | $301,000 | $148,000 | $153,000 |
| 2020 | $5,042 | $291,600 | $142,300 | $149,300 |
| 2019 | $5,427 | $254,400 | $136,000 | $118,400 |
| 2018 | $4,321 | $240,600 | $136,000 | $104,600 |
| 2017 | $4,198 | $229,400 | $129,700 | $99,700 |
| 2016 | $4,099 | $225,700 | $129,700 | $96,000 |
| 2015 | $3,959 | $222,900 | $128,800 | $94,100 |
| 2014 | $3,801 | $218,800 | $126,100 | $92,700 |
Source: Public Records
Map
Nearby Homes
- 261 Plymouth St
- 455 Plymouth St
- 71 Church St
- 391 Bedford St
- 78 Crystal Water Dr
- 590 Bedford St
- 41 Bedford St
- 28 Brookbend Way E
- 217 Crystal Water Dr
- 121 South St
- 182 Crystal Water Dr Unit 182
- 282 Spring St
- 587 Bridge St
- 11 Harmony Crossing
- 11 Willow Ave
- 1 Simmons Place
- 26 Meadowbrook Dr
- 52 Cottage St
- 9 Hemlock Dr
- 14 Mountain Ash Rd
- 57 Allen St
- 58 Allen St
- 48 Allen St
- 48 Allen St
- 93 Allen St
- 29 Allen St
- 26 Allen St
- 19 Allen St
- 226 Plymouth St
- 210 Plymouth St
- 202 Plymouth St
- 182 Plymouth St
- 217 Plymouth St Unit 2
- 217 Plymouth St Unit 1
- 217 Plymouth St
- 231 Plymouth St
- 179 Plymouth St
- 215 Plymouth St
- 171 Plymouth St
- 154 Plymouth St