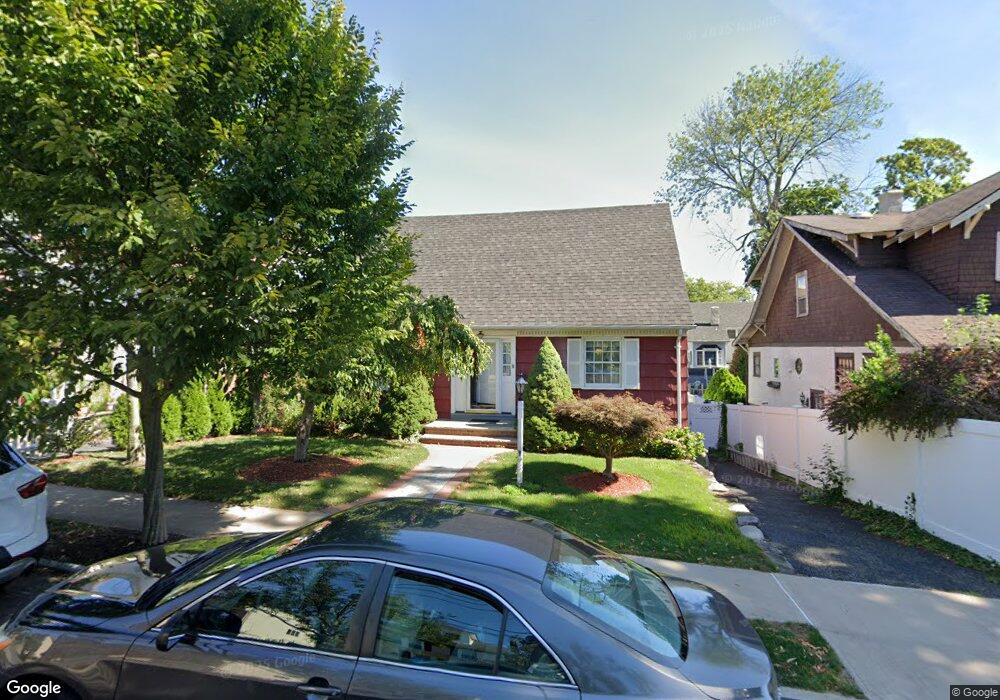
67 Bishop St Staten Island, NY 10306
New Dorp NeighborhoodEstimated Value: $721,000 - $793,000
2
Beds
2
Baths
1,050
Sq Ft
$722/Sq Ft
Est. Value
About This Home
This home is located at 67 Bishop St, Staten Island, NY 10306 and is currently estimated at $757,604, approximately $721 per square foot. 67 Bishop St is a home located in Richmond County with nearby schools including P.S. 23 Richmondtown, Myra S. Barnes Intermediate School 24, and New Dorp High School.
Ownership History
Date
Name
Owned For
Owner Type
Purchase Details
Closed on
Nov 17, 2006
Sold by
Sharkey Christopher J and Kempisty Lynn
Bought by
Sharkey Joseph F and Martinez Sharkey Eunice
Current Estimated Value
Home Financials for this Owner
Home Financials are based on the most recent Mortgage that was taken out on this home.
Original Mortgage
$445,000
Outstanding Balance
$265,582
Interest Rate
6.37%
Mortgage Type
New Conventional
Estimated Equity
$492,022
Purchase Details
Closed on
Nov 30, 2004
Sold by
Sharkey Joseph F and Sharkey Joseph F
Bought by
Sharkey Joseph F and Sharkey Christopher J
Purchase Details
Closed on
Jan 12, 2004
Sold by
Sharkey Joseph F
Bought by
Sharkey Joseph F and Sharkey Joseph F
Home Financials for this Owner
Home Financials are based on the most recent Mortgage that was taken out on this home.
Original Mortgage
$30,760
Interest Rate
6.25%
Mortgage Type
New Conventional
Create a Home Valuation Report for This Property
The Home Valuation Report is an in-depth analysis detailing your home's value as well as a comparison with similar homes in the area
Home Values in the Area
Average Home Value in this Area
Purchase History
| Date | Buyer | Sale Price | Title Company |
|---|---|---|---|
| Sharkey Joseph F | $286,666 | None Available | |
| Sharkey Joseph F | -- | None Available | |
| Sharkey Joseph F | -- | None Available | |
| Sharkey Joseph F | -- | -- |
Source: Public Records
Mortgage History
| Date | Status | Borrower | Loan Amount |
|---|---|---|---|
| Open | Sharkey Joseph F | $445,000 | |
| Previous Owner | Sharkey Joseph F | $30,760 |
Source: Public Records
Tax History Compared to Growth
Tax History
| Year | Tax Paid | Tax Assessment Tax Assessment Total Assessment is a certain percentage of the fair market value that is determined by local assessors to be the total taxable value of land and additions on the property. | Land | Improvement |
|---|---|---|---|---|
| 2025 | $7,368 | $45,360 | $12,092 | $33,268 |
| 2024 | $7,368 | $40,080 | $12,961 | $27,119 |
| 2023 | $7,147 | $35,191 | $12,916 | $22,275 |
| 2022 | $6,628 | $33,900 | $14,160 | $19,740 |
| 2021 | $6,793 | $32,280 | $14,160 | $18,120 |
| 2020 | $6,859 | $35,640 | $14,160 | $21,480 |
| 2019 | $6,395 | $31,740 | $14,160 | $17,580 |
| 2018 | $5,978 | $29,326 | $11,458 | $17,868 |
| 2017 | $5,640 | $27,667 | $12,556 | $15,111 |
| 2016 | $5,422 | $27,120 | $14,160 | $12,960 |
| 2015 | $4,889 | $27,003 | $11,223 | $15,780 |
| 2014 | $4,889 | $25,476 | $9,802 | $15,674 |
Source: Public Records
Map
Nearby Homes
- 71 Bishop St
- 63 Bishop St
- 59 Bishop St
- 77 Bishop St Unit 79
- 77-79 Bishop St
- 68 Dale Ave
- 62 Dale Ave
- 72 Dale Ave
- 57 Bishop St
- 58 Dale Ave
- 76 Dale Ave
- 83-85 Bishop St
- 53 Bishop St
- 83 Bishop St Unit 85
- 64 Bishop St
- 62-65 Bishop St
- 70 Bishop St
- 62 Bishop St Unit 65
- 62 Bishop St Unit A
- 62 Bishop St Unit B