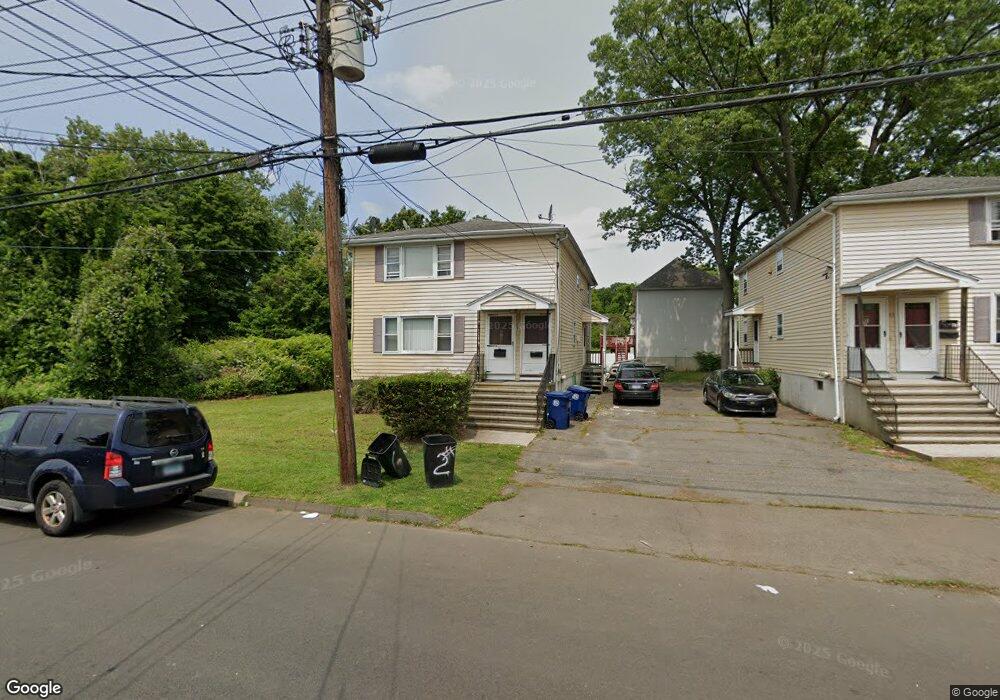
67 Blohm St West Haven, CT 06516
West Haven Center NeighborhoodEstimated Value: $378,000 - $476,000
6
Beds
2
Baths
2,112
Sq Ft
$205/Sq Ft
Est. Value
About This Home
This home is located at 67 Blohm St, West Haven, CT 06516 and is currently estimated at $433,621, approximately $205 per square foot. 67 Blohm St is a home located in New Haven County with nearby schools including Carrigan 5/6 Intermediate School, Harry M. Bailey Middle School, and West Haven High School.
Ownership History
Date
Name
Owned For
Owner Type
Purchase Details
Closed on
Jul 28, 2021
Sold by
Minaudo Joseph and Minaudo Mary
Bought by
Minaudo Ft and Minaudo
Current Estimated Value
Purchase Details
Closed on
Mar 31, 2009
Sold by
Yapur Sandra
Bought by
Minaudo Mary and Minaudo Joseph
Purchase Details
Closed on
Jun 30, 2005
Sold by
Zakos Stephen L and Zakos Claire
Bought by
Yapur Sandra
Home Financials for this Owner
Home Financials are based on the most recent Mortgage that was taken out on this home.
Original Mortgage
$248,000
Interest Rate
5.73%
Mortgage Type
Purchase Money Mortgage
Purchase Details
Closed on
Jul 8, 2003
Sold by
Donegan Joyce P
Bought by
Zakos Stephen L and Zakos Claire E
Home Financials for this Owner
Home Financials are based on the most recent Mortgage that was taken out on this home.
Original Mortgage
$139,500
Interest Rate
5.46%
Mortgage Type
Purchase Money Mortgage
Create a Home Valuation Report for This Property
The Home Valuation Report is an in-depth analysis detailing your home's value as well as a comparison with similar homes in the area
Home Values in the Area
Average Home Value in this Area
Purchase History
| Date | Buyer | Sale Price | Title Company |
|---|---|---|---|
| Minaudo Ft | -- | None Available | |
| Minaudo Ft | -- | None Available | |
| Minaudo Mary | $1,555,000 | -- | |
| Minaudo Mary | $1,555,000 | -- | |
| Yapur Sandra | $310,000 | -- | |
| Yapur Sandra | $310,000 | -- | |
| Zakos Stephen L | $155,000 | -- | |
| Zakos Stephen L | $155,000 | -- |
Source: Public Records
Mortgage History
| Date | Status | Borrower | Loan Amount |
|---|---|---|---|
| Previous Owner | Zakos Stephen L | $248,000 | |
| Previous Owner | Zakos Stephen L | $139,500 |
Source: Public Records
Tax History
| Year | Tax Paid | Tax Assessment Tax Assessment Total Assessment is a certain percentage of the fair market value that is determined by local assessors to be the total taxable value of land and additions on the property. | Land | Improvement |
|---|---|---|---|---|
| 2025 | $8,387 | $242,900 | $63,910 | $178,990 |
| 2024 | $8,128 | $167,510 | $44,240 | $123,270 |
| 2023 | $7,791 | $167,510 | $44,240 | $123,270 |
| 2022 | $7,638 | $167,510 | $44,240 | $123,270 |
| 2021 | $7,638 | $167,510 | $44,240 | $123,270 |
| 2020 | $6,939 | $137,480 | $35,910 | $101,570 |
| 2019 | $6,691 | $137,480 | $35,910 | $101,570 |
| 2018 | $6,633 | $137,480 | $35,910 | $101,570 |
| 2017 | $6,277 | $137,480 | $35,910 | $101,570 |
| 2016 | $6,264 | $137,480 | $35,910 | $101,570 |
| 2015 | $5,544 | $137,410 | $38,570 | $98,840 |
| 2014 | $5,510 | $137,410 | $38,570 | $98,840 |
Source: Public Records
Map
Nearby Homes
Your Personal Tour Guide
Ask me questions while you tour the home.