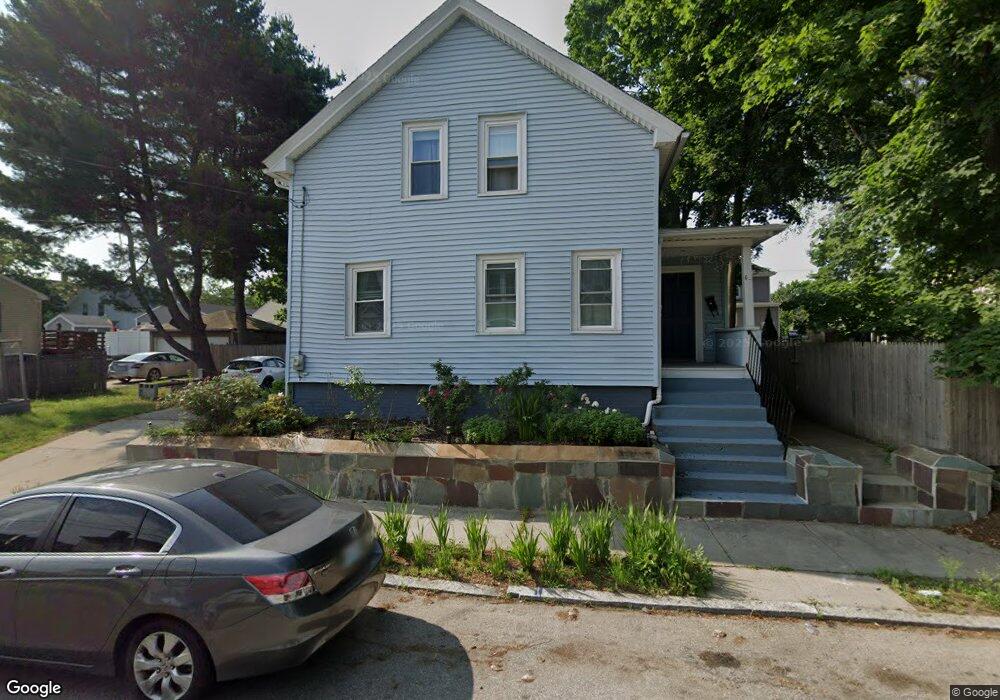
67 Carr St Providence, RI 02905
Washington Park NeighborhoodEstimated Value: $326,000 - $396,000
3
Beds
2
Baths
1,161
Sq Ft
$309/Sq Ft
Est. Value
About This Home
This home is located at 67 Carr St, Providence, RI 02905 and is currently estimated at $358,466, approximately $308 per square foot. 67 Carr St is a home located in Providence County with nearby schools including Asa Messer Elementary School, Charles N. Fortes Elementary School, and Alan Shawn Feinstein Elementary.
Ownership History
Date
Name
Owned For
Owner Type
Purchase Details
Closed on
Jul 31, 2018
Sold by
Helping Hands Commnity
Bought by
Lucia Steven H and Gomez Margomi C
Current Estimated Value
Home Financials for this Owner
Home Financials are based on the most recent Mortgage that was taken out on this home.
Original Mortgage
$198,412
Outstanding Balance
$174,711
Interest Rate
5.25%
Mortgage Type
FHA
Estimated Equity
$183,755
Purchase Details
Closed on
Sep 29, 2015
Sold by
Department Of Housing & Urban Dev
Bought by
Jp Morgan Chase Bank N
Purchase Details
Closed on
Apr 23, 2015
Sold by
Jp Morgan Chase Bank N
Bought by
Department Of Housing & Urban Dev
Purchase Details
Closed on
Feb 28, 2013
Sold by
King Mary A and Jp Morgan Chase Bank N
Bought by
Jp Morgan Chase Bank N
Create a Home Valuation Report for This Property
The Home Valuation Report is an in-depth analysis detailing your home's value as well as a comparison with similar homes in the area
Home Values in the Area
Average Home Value in this Area
Purchase History
| Date | Buyer | Sale Price | Title Company |
|---|---|---|---|
| Lucia Steven H | $205,000 | -- | |
| Jp Morgan Chase Bank N | -- | -- | |
| Department Of Housing & Urban Dev | -- | -- | |
| Jp Morgan Chase Bank N | $14,508 | -- |
Source: Public Records
Mortgage History
| Date | Status | Borrower | Loan Amount |
|---|---|---|---|
| Open | Lucia Steven H | $198,412 | |
| Previous Owner | Department Of Housing & Urban Dev | $130,173 | |
| Previous Owner | Department Of Housing & Urban Dev | $100,000 | |
| Previous Owner | Department Of Housing & Urban Dev | $50,000 |
Source: Public Records
Tax History Compared to Growth
Tax History
| Year | Tax Paid | Tax Assessment Tax Assessment Total Assessment is a certain percentage of the fair market value that is determined by local assessors to be the total taxable value of land and additions on the property. | Land | Improvement |
|---|---|---|---|---|
| 2025 | $2,574 | $306,400 | $118,800 | $187,600 |
| 2024 | $4,081 | $222,400 | $75,300 | $147,100 |
| 2023 | $4,081 | $222,400 | $75,300 | $147,100 |
| 2022 | $3,959 | $222,400 | $75,300 | $147,100 |
| 2021 | $3,217 | $131,000 | $33,200 | $97,800 |
| 2020 | $3,217 | $131,000 | $33,200 | $97,800 |
| 2019 | $3,217 | $131,000 | $33,200 | $97,800 |
| 2018 | $3,039 | $95,100 | $30,200 | $64,900 |
| 2017 | $3,039 | $95,100 | $30,200 | $64,900 |
| 2016 | $3,039 | $95,100 | $30,200 | $64,900 |
| 2015 | $3,058 | $92,400 | $30,200 | $62,200 |
| 2014 | $3,119 | $92,400 | $30,200 | $62,200 |
| 2013 | $3,119 | $92,400 | $30,200 | $62,200 |
Source: Public Records
Map
Nearby Homes