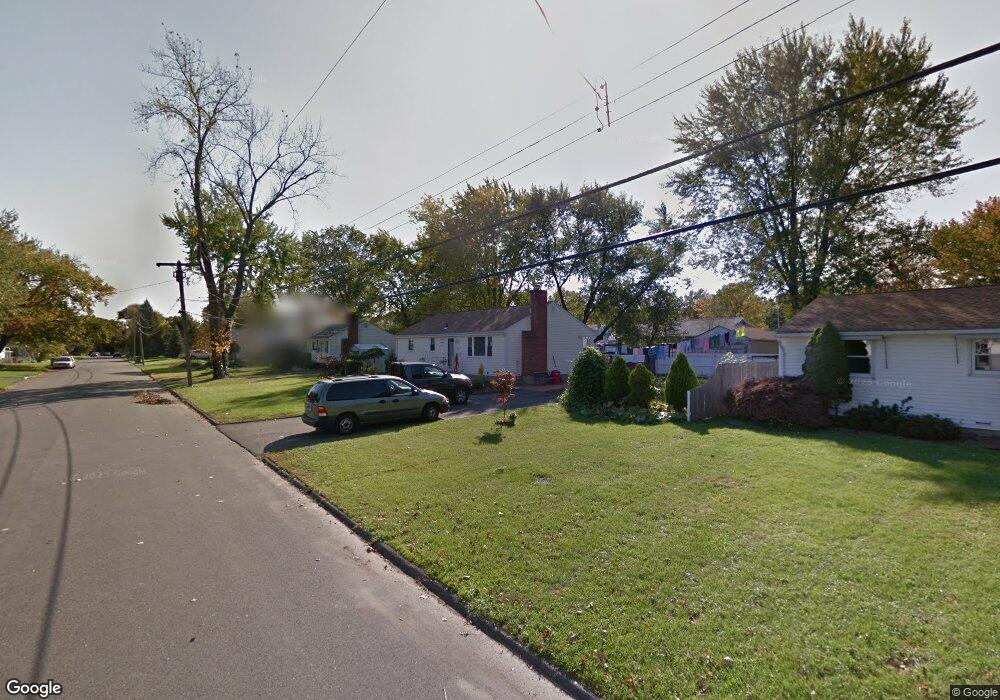
67 Carson Ave Wethersfield, CT 06109
Estimated Value: $289,000 - $331,000
3
Beds
1
Bath
1,056
Sq Ft
$296/Sq Ft
Est. Value
About This Home
This home is located at 67 Carson Ave, Wethersfield, CT 06109 and is currently estimated at $312,627, approximately $296 per square foot. 67 Carson Ave is a home located in Hartford County with nearby schools including Emerson-Williams School, Silas Deane Middle School, and Wethersfield High School.
Ownership History
Date
Name
Owned For
Owner Type
Purchase Details
Closed on
Aug 31, 2004
Sold by
Cosgrove Christopher J
Bought by
Deodat Bhomattie and Deodat Roopnarine
Current Estimated Value
Purchase Details
Closed on
Jun 1, 2000
Sold by
Zaino Nerino
Bought by
Cosgrove Christopher J
Create a Home Valuation Report for This Property
The Home Valuation Report is an in-depth analysis detailing your home's value as well as a comparison with similar homes in the area
Home Values in the Area
Average Home Value in this Area
Purchase History
| Date | Buyer | Sale Price | Title Company |
|---|---|---|---|
| Deodat Bhomattie | $175,000 | -- | |
| Cosgrove Christopher J | $110,000 | -- |
Source: Public Records
Mortgage History
| Date | Status | Borrower | Loan Amount |
|---|---|---|---|
| Closed | Cosgrove Christopher J | $37,100 | |
| Open | Cosgrove Christopher J | $108,700 | |
| Closed | Cosgrove Christopher J | $150,000 |
Source: Public Records
Tax History
| Year | Tax Paid | Tax Assessment Tax Assessment Total Assessment is a certain percentage of the fair market value that is determined by local assessors to be the total taxable value of land and additions on the property. | Land | Improvement |
|---|---|---|---|---|
| 2025 | $7,929 | $192,370 | $69,970 | $122,400 |
| 2024 | $6,397 | $148,020 | $72,100 | $75,920 |
| 2023 | $6,189 | $148,140 | $72,100 | $76,040 |
| 2022 | $5,600 | $136,310 | $72,100 | $64,210 |
| 2021 | $5,544 | $136,310 | $72,100 | $64,210 |
| 2020 | $5,546 | $136,310 | $72,100 | $64,210 |
| 2019 | $5,553 | $136,310 | $72,100 | $64,210 |
| 2018 | $5,501 | $134,900 | $69,400 | $65,500 |
| 2017 | $5,365 | $134,900 | $69,400 | $65,500 |
| 2016 | $5,199 | $134,900 | $69,400 | $65,500 |
| 2015 | $5,152 | $134,900 | $69,400 | $65,500 |
| 2014 | $4,956 | $134,900 | $69,400 | $65,500 |
Source: Public Records
Map
Nearby Homes
- 1 Bristol St
- 19 Albert Ave
- 295 Ridge Rd Unit 8
- 192 Wolcott Hill Rd
- 219-221 Jordan Ln
- 173 Timber Trail
- 273 Forest Dr
- 20 Forest Dr
- 23 Hillcrest Ave
- 764 Ridge Rd
- 129 Goff Rd
- 18 Avalon Place
- 107 Harmund Place
- 35 Kingston St
- 158 Dix Rd
- 87 Somerset St
- 91 Somerset St
- 62 Schoolhouse Crossing
- 1 Fernwood St
- 317-319 Garden St
Your Personal Tour Guide
Ask me questions while you tour the home.