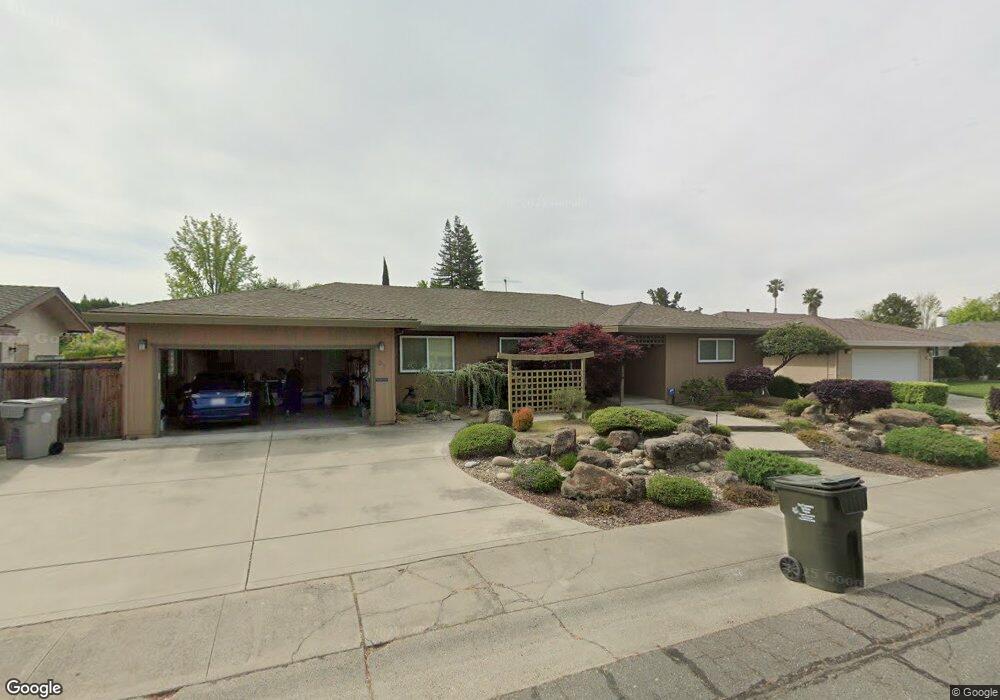
67 Cavalcade Cir Sacramento, CA 95831
Pocket-Greenhaven NeighborhoodEstimated Value: $676,300 - $740,000
4
Beds
3
Baths
2,166
Sq Ft
$328/Sq Ft
Est. Value
About This Home
This home is located at 67 Cavalcade Cir, Sacramento, CA 95831 and is currently estimated at $709,825, approximately $327 per square foot. 67 Cavalcade Cir is a home located in Sacramento County with nearby schools including Caroline Wenzel Elementary School, Sam Brannan Middle School, and John F. Kennedy High School.
Ownership History
Date
Name
Owned For
Owner Type
Purchase Details
Closed on
Apr 1, 2013
Sold by
Yang Richard L and Yang Irene K
Bought by
Yang Richard L and Yang Irene K
Current Estimated Value
Purchase Details
Closed on
Jul 15, 2005
Sold by
Yang Irene K and Yang Richard L
Bought by
Yang Richard L and Yang Irene K
Home Financials for this Owner
Home Financials are based on the most recent Mortgage that was taken out on this home.
Original Mortgage
$160,000
Interest Rate
5.51%
Mortgage Type
New Conventional
Purchase Details
Closed on
Nov 14, 2002
Sold by
Tamizato Irene K
Bought by
Tamizato Irene K and Yang Richard L
Home Financials for this Owner
Home Financials are based on the most recent Mortgage that was taken out on this home.
Original Mortgage
$115,000
Interest Rate
5.89%
Purchase Details
Closed on
Feb 11, 1999
Sold by
Tamizato Kengo
Bought by
Tamizato Irene K
Create a Home Valuation Report for This Property
The Home Valuation Report is an in-depth analysis detailing your home's value as well as a comparison with similar homes in the area
Home Values in the Area
Average Home Value in this Area
Purchase History
| Date | Buyer | Sale Price | Title Company |
|---|---|---|---|
| Yang Richard L | -- | None Available | |
| Yang Richard L | -- | Financial Title Company | |
| Tamizato Irene K | -- | Placer Title Company | |
| Tamizato Irene K | -- | -- |
Source: Public Records
Mortgage History
| Date | Status | Borrower | Loan Amount |
|---|---|---|---|
| Closed | Yang Richard L | $160,000 | |
| Closed | Tamizato Irene K | $115,000 |
Source: Public Records
Tax History
| Year | Tax Paid | Tax Assessment Tax Assessment Total Assessment is a certain percentage of the fair market value that is determined by local assessors to be the total taxable value of land and additions on the property. | Land | Improvement |
|---|---|---|---|---|
| 2025 | $3,936 | $314,283 | $74,854 | $239,429 |
| 2024 | $3,936 | $308,122 | $73,387 | $234,735 |
| 2023 | $3,837 | $302,082 | $71,949 | $230,133 |
| 2022 | $3,786 | $296,160 | $70,539 | $225,621 |
| 2021 | $3,607 | $290,354 | $69,156 | $221,198 |
| 2020 | $3,627 | $287,377 | $68,447 | $218,930 |
| 2019 | $3,550 | $281,743 | $67,105 | $214,638 |
| 2018 | $3,459 | $276,220 | $65,790 | $210,430 |
| 2017 | $3,407 | $270,804 | $64,500 | $206,304 |
| 2016 | $3,309 | $265,495 | $63,236 | $202,259 |
| 2015 | $3,257 | $261,508 | $62,287 | $199,221 |
| 2014 | $3,180 | $256,386 | $61,067 | $195,319 |
Source: Public Records
Map
Nearby Homes
- 20 Keel Ct
- 28 Keel Ct
- 10 Capay Ct
- 217 Roundtree Ct
- 6913 Greenhaven Dr
- 7040 Waterview Way
- 6823 Greenhaven Dr
- 14 Rose River Ct
- 6795 Havenhurst Dr
- 58 Los Gatos Cir
- 6241 Riverside Blvd
- 6829 Havenhurst Dr
- 672 Clipper Way
- 7171 Westmoreland Way
- 7351 Perera Cir
- 6797 Frates Way
- 58 Rambleoak Cir
- 534 Valim Way
- 67 Rambleoak Cir
- 14 Morningsun Ct
- 63 Cavalcade Cir
- 71 Cavalcade Cir
- 17 Havenwood Cir
- 21 Havenwood Cir
- 13 Havenwood Cir
- 59 Cavalcade Cir
- 68 Cavalcade Cir
- 75 Cavalcade Cir
- 64 Cavalcade Cir
- 72 Cavalcade Cir
- 25 Havenwood Cir
- 9 Havenwood Cir
- 60 Cavalcade Cir
- 76 Cavalcade Cir
- 55 Cavalcade Cir
- 79 Cavalcade Cir
- 29 Havenwood Cir
- 18 Havenwood Cir
- 20 Cavalcade Cir
- 22 Havenwood Cir
Your Personal Tour Guide
Ask me questions while you tour the home.