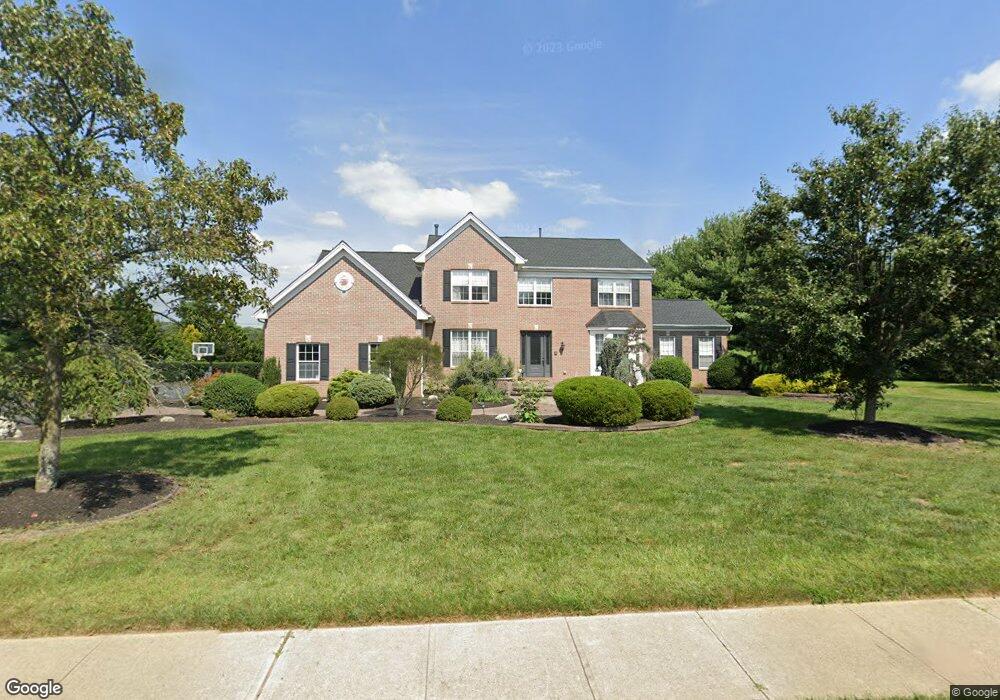
67 Cliffwood Dr Allentown, NJ 08501
Estimated Value: $1,086,000 - $1,150,000
4
Beds
3
Baths
3,474
Sq Ft
$322/Sq Ft
Est. Value
About This Home
This home is located at 67 Cliffwood Dr, Allentown, NJ 08501 and is currently estimated at $1,119,457, approximately $322 per square foot. 67 Cliffwood Dr is a home located in Monmouth County with nearby schools including Newell Elementary School, Stonebridge Middle School, and Allentown High School.
Ownership History
Date
Name
Owned For
Owner Type
Purchase Details
Closed on
Nov 11, 2008
Sold by
Ardolino Arthur J and Ardolino Donna Jean
Bought by
Stathopoulos Basilios and Stathopoulos Olga
Current Estimated Value
Home Financials for this Owner
Home Financials are based on the most recent Mortgage that was taken out on this home.
Original Mortgage
$417,000
Outstanding Balance
$278,951
Interest Rate
6.47%
Mortgage Type
Purchase Money Mortgage
Estimated Equity
$840,506
Purchase Details
Closed on
Jan 17, 2001
Sold by
Model Funding I Llc
Bought by
Ardolino Arthur and Ardolino Donna
Home Financials for this Owner
Home Financials are based on the most recent Mortgage that was taken out on this home.
Original Mortgage
$400,000
Interest Rate
7.52%
Purchase Details
Closed on
Apr 29, 1998
Sold by
Hovnanian K
Bought by
Model Funding
Create a Home Valuation Report for This Property
The Home Valuation Report is an in-depth analysis detailing your home's value as well as a comparison with similar homes in the area
Home Values in the Area
Average Home Value in this Area
Purchase History
| Date | Buyer | Sale Price | Title Company |
|---|---|---|---|
| Stathopoulos Basilios | $585,000 | Multiple | |
| Ardolino Arthur | $449,000 | -- | |
| Model Funding | $388,950 | -- |
Source: Public Records
Mortgage History
| Date | Status | Borrower | Loan Amount |
|---|---|---|---|
| Open | Stathopoulos Basilios | $417,000 | |
| Previous Owner | Ardolino Arthur | $400,000 | |
| Closed | Model Funding | $0 |
Source: Public Records
Tax History Compared to Growth
Tax History
| Year | Tax Paid | Tax Assessment Tax Assessment Total Assessment is a certain percentage of the fair market value that is determined by local assessors to be the total taxable value of land and additions on the property. | Land | Improvement |
|---|---|---|---|---|
| 2025 | $19,244 | $1,005,600 | $263,600 | $742,000 |
| 2024 | $17,068 | $892,600 | $196,600 | $696,000 |
| 2023 | $17,068 | $768,500 | $206,600 | $561,900 |
| 2022 | $14,611 | $693,600 | $158,600 | $535,000 |
| 2021 | $14,611 | $602,500 | $213,600 | $388,900 |
| 2020 | $14,279 | $591,500 | $213,600 | $377,900 |
| 2019 | $14,205 | $592,600 | $213,600 | $379,000 |
| 2018 | $14,282 | $587,000 | $220,600 | $366,400 |
| 2017 | $13,998 | $583,000 | $220,600 | $362,400 |
| 2016 | $13,836 | $583,300 | $225,200 | $358,100 |
| 2015 | $14,483 | $617,100 | $191,200 | $425,900 |
| 2014 | $13,140 | $564,200 | $101,200 | $463,000 |
Source: Public Records
Map
Nearby Homes
- 65 Cliffwood Dr
- 2 Somerset Ct
- 1285 Old York Rd
- 1275 Old York Rd
- 1277 Old York Rd
- 1289 Old York Rd
- 1 Somerset Ct
- 1311 Old York Rd
- 63 Cliffwood Dr
- 4 Somerset Ct
- 3 Somerset Ct
- 10 Jennings Dr
- 8 Jennings Dr
- 61 Cliffwood Dr
- 6 Jennings Dr
- 11 Jennings Dr
- 9 Jennings Dr
- 59 Cliffwood Dr
- 1333 Old York Rd
- 7 Jennings Dr