67 Clinton St Concord, NH 03301
South End NeighborhoodEstimated Value: $489,000 - $687,000
3
Beds
2
Baths
1,498
Sq Ft
$380/Sq Ft
Est. Value
About This Home
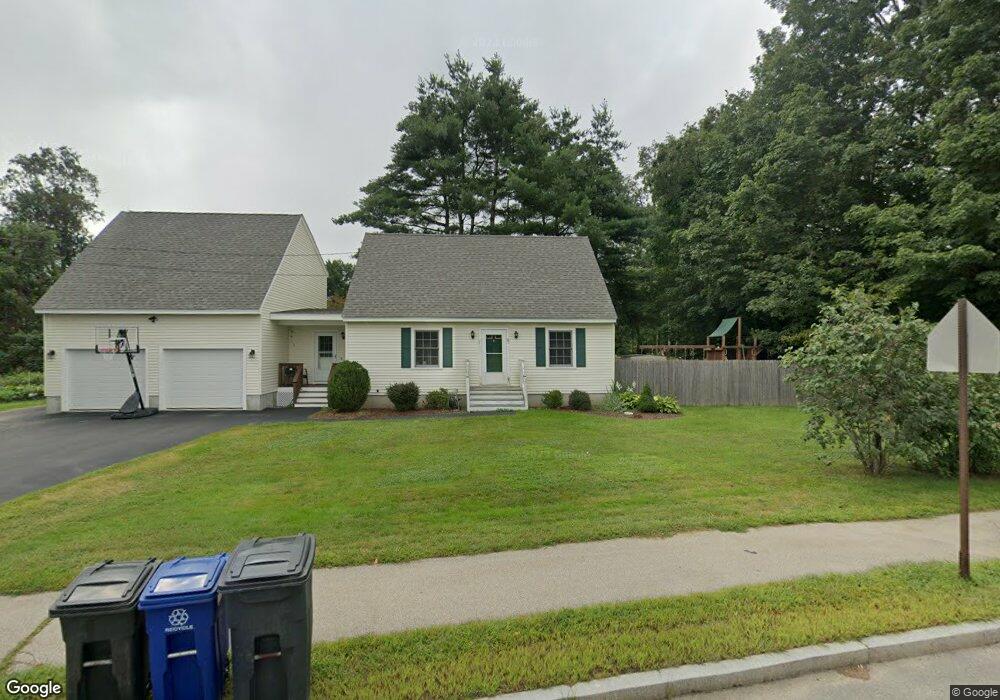
This home is located at 67 Clinton St, Concord, NH 03301 and is currently estimated at $569,234, approximately $379 per square foot. 67 Clinton St is a home located in Merrimack County with nearby schools including Abbot-Downing School, Rundlett Middle School, and Concord High School.
Ownership History
Date
Name
Owned For
Owner Type
Purchase Details
Closed on
Nov 30, 2011
Sold by
Sullivan Stephen F and Sullivan Cynthia A
Bought by
Deroche Scott J and Deroche Kerissa A
Current Estimated Value
Home Financials for this Owner
Home Financials are based on the most recent Mortgage that was taken out on this home.
Original Mortgage
$160,817
Outstanding Balance
$110,484
Interest Rate
4.1%
Mortgage Type
Purchase Money Mortgage
Estimated Equity
$458,750
Create a Home Valuation Report for This Property
The Home Valuation Report is an in-depth analysis detailing your home's value as well as a comparison with similar homes in the area
Home Values in the Area
Average Home Value in this Area
Purchase History
| Date | Buyer | Sale Price | Title Company |
|---|---|---|---|
| Deroche Scott J | $165,000 | -- |
Source: Public Records
Mortgage History
| Date | Status | Borrower | Loan Amount |
|---|---|---|---|
| Open | Deroche Scott J | $160,817 |
Source: Public Records
Tax History Compared to Growth
Tax History
| Year | Tax Paid | Tax Assessment Tax Assessment Total Assessment is a certain percentage of the fair market value that is determined by local assessors to be the total taxable value of land and additions on the property. | Land | Improvement |
|---|---|---|---|---|
| 2024 | $10,902 | $393,700 | $110,000 | $283,700 |
| 2023 | $10,575 | $393,700 | $110,000 | $283,700 |
| 2022 | $10,193 | $393,700 | $110,000 | $283,700 |
| 2021 | $10,334 | $411,400 | $110,000 | $301,400 |
| 2020 | $6,778 | $253,300 | $87,900 | $165,400 |
| 2019 | $5,987 | $215,500 | $84,000 | $131,500 |
| 2018 | $5,937 | $210,600 | $80,700 | $129,900 |
| 2017 | $5,812 | $205,800 | $80,700 | $125,100 |
| 2016 | $5,470 | $197,700 | $79,200 | $118,500 |
| 2015 | $5,263 | $193,300 | $86,000 | $107,300 |
| 2014 | $5,182 | $193,300 | $86,000 | $107,300 |
| 2013 | -- | $191,200 | $86,000 | $105,200 |
| 2012 | -- | $187,800 | $86,000 | $101,800 |
Source: Public Records
Map
Nearby Homes
- 122 South St
- 12 Avon St
- 0 South St Unit 4969509
- 22 Wilson Ave
- 15 Wilson Ave
- 47 South St
- 2 Kensington Rd
- 0 Spruce St Unit 88
- 1 Kensington Rd
- 33 Spruce St
- 24 Badger St
- 105 S Main St
- 14 Downing St
- 75 S State St
- 14-16 Perley St
- 10 Perley St
- 54 Pleasant St Unit 8
- 87 S Main St Unit 2
- 4 Fayette St
- 376 S Main St