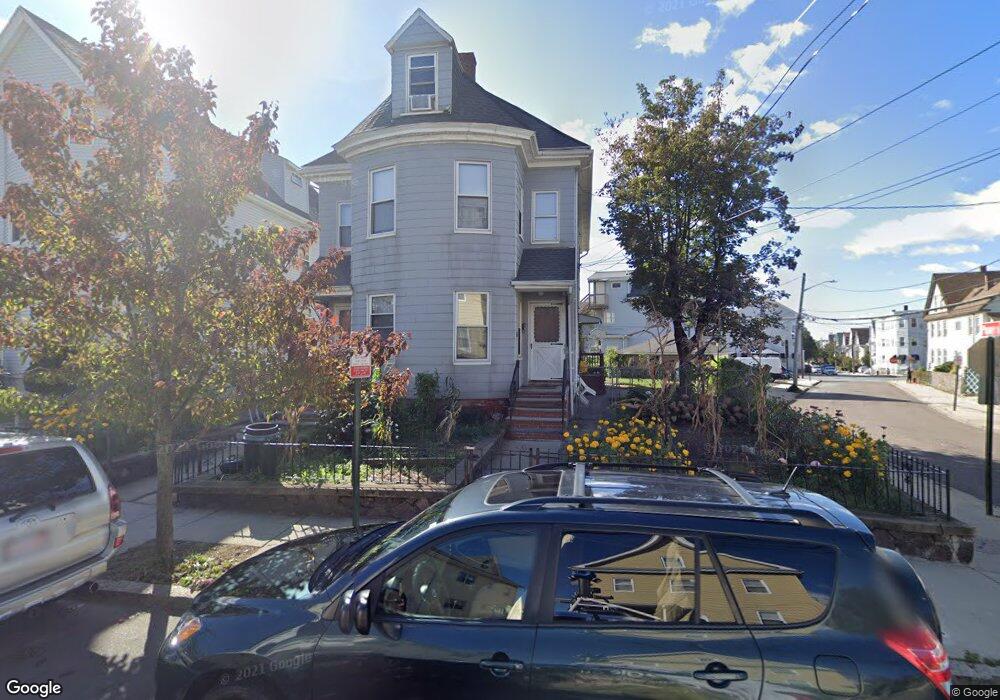
67 Cottage St Everett, MA 02149
Downtown Everett NeighborhoodEstimated Value: $912,000 - $969,000
About This Home
This home is located at 67 Cottage St, Everett, MA 02149 and is currently estimated at $932,887, approximately $301 per square foot. 67 Cottage St is a home located in Middlesex County with nearby schools including Everett High School, Pioneer Charter School of Science, and St Anthony School.
Ownership History
We collect this data history from publicly available records. To have your information removed, we recommend requesting removal directly through your county’s website.
Purchase Details
Home Financials for this Owner
Home Financials are based on the most recent Mortgage that was taken out on this home.Home Values in the Area
Average Home Value in this Area
Purchase History
We collect this data history from publicly available records. To have your information removed, we recommend requesting removal directly through your county’s website.
| Date | Buyer | Sale Price | Title Company |
|---|---|---|---|
| $455,000 | -- |
Mortgage History
We collect this data history from publicly available records. To have your information removed, we recommend requesting removal directly through your county’s website.
| Date | Status | Borrower | Loan Amount |
|---|---|---|---|
| Open | $318,500 |
Tax History
We collect this data history from publicly available records. To have your information removed, we recommend requesting removal directly through your county’s website.
| Year | Tax Paid | Tax Assessment Tax Assessment Total Assessment is a certain percentage of the fair market value that is determined by local assessors to be the total taxable value of land and additions on the property. | Land | Improvement |
|---|---|---|---|---|
| 2025 | $9,082 | $797,400 | $268,500 | $528,900 |
| 2024 | $8,398 | $732,800 | $245,500 | $487,300 |
| 2023 | $8,201 | $696,200 | $235,300 | $460,900 |
| 2022 | $6,643 | $641,200 | $214,800 | $426,400 |
| 2021 | $5,840 | $591,700 | $181,600 | $410,100 |
| 2020 | $6,145 | $577,500 | $181,600 | $395,900 |
| 2019 | $6,471 | $522,700 | $169,300 | $353,400 |
| 2018 | $6,339 | $460,000 | $147,300 | $312,700 |
| 2017 | $5,701 | $394,800 | $112,500 | $282,300 |
| 2016 | $5,267 | $364,500 | $111,800 | $252,700 |
| 2015 | $4,848 | $331,800 | $97,200 | $234,600 |
Map
- 59 Chelsea St Unit 31 & 33
- 59 Chelsea St Unit 13
- 59 Chelsea St Unit 12
- 59 Chelsea St Unit 33
- 59 Chelsea St Unit 25
- 59 Chelsea St Unit G1
- 59 Chelsea St Unit 10
- 59 Chelsea St Unit G3
- 59 Chelsea St Unit 24
- 59 Chelsea St Unit 1G
- 59 Chelsea St Unit 21
- 59 Chelsea St Unit 31
- 59 Chelsea St Unit 30
- 59 Chelsea St Unit 22
- 59 Chelsea St
- 59 Chelsea St Unit 1
- 59 Chelsea St Unit 3
- 59 Chelsea St Unit 2
- 59 Chelsea St Unit G2
- 59 Chelsea St Unit 23
Ask me questions while you tour the home.