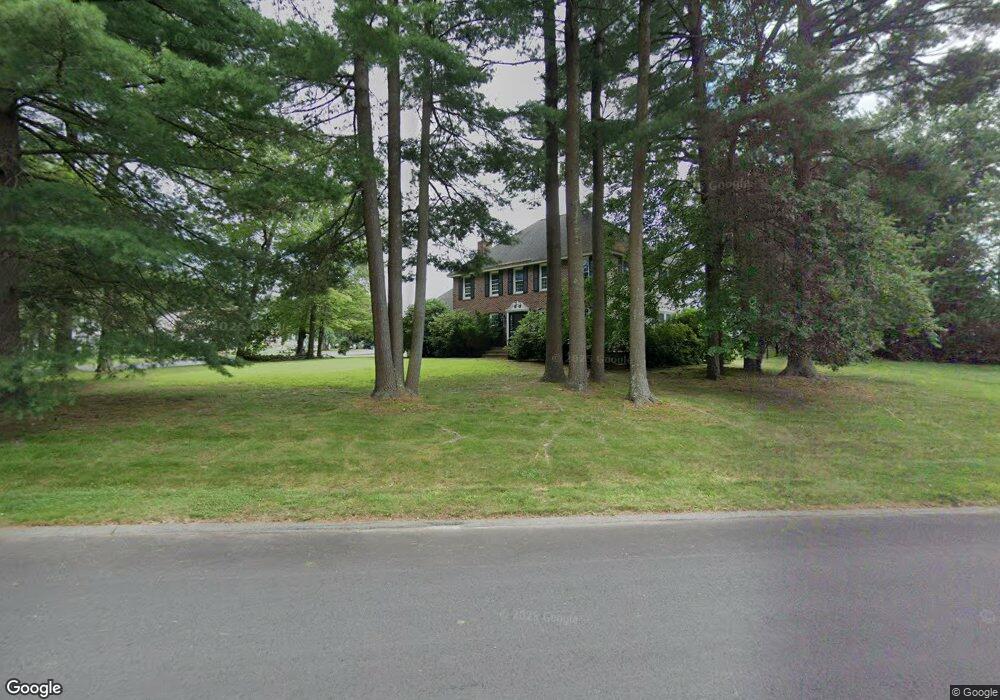
67 Cox Ln Methuen, MA 01844
The North End NeighborhoodEstimated Value: $792,275 - $816,000
4
Beds
3
Baths
2,536
Sq Ft
$319/Sq Ft
Est. Value
About This Home
This home is located at 67 Cox Ln, Methuen, MA 01844 and is currently estimated at $809,569, approximately $319 per square foot. 67 Cox Ln is a home located in Essex County with nearby schools including Methuen High School and The Birches Academy of Academics and Art.
Ownership History
Date
Name
Owned For
Owner Type
Purchase Details
Closed on
Sep 7, 2016
Sold by
Bazin Susan J
Bought by
Bazin Nt and Bazin
Current Estimated Value
Purchase Details
Closed on
Mar 2, 2010
Sold by
Norma A Bazin Rt and Bazin
Bought by
Bazin Susan J
Home Financials for this Owner
Home Financials are based on the most recent Mortgage that was taken out on this home.
Original Mortgage
$120,000
Interest Rate
4.97%
Create a Home Valuation Report for This Property
The Home Valuation Report is an in-depth analysis detailing your home's value as well as a comparison with similar homes in the area
Home Values in the Area
Average Home Value in this Area
Purchase History
| Date | Buyer | Sale Price | Title Company |
|---|---|---|---|
| Bazin Nt | -- | -- | |
| Bazin Nt | -- | -- | |
| Bazin Nt | -- | -- | |
| Bazin Susan J | -- | -- | |
| Bazin Susan J | -- | -- |
Source: Public Records
Mortgage History
| Date | Status | Borrower | Loan Amount |
|---|---|---|---|
| Previous Owner | Bazin Susan J | $120,000 | |
| Previous Owner | Bazin Susan J | $100,000 | |
| Previous Owner | Bazin Susan J | $100,000 |
Source: Public Records
Tax History
| Year | Tax Paid | Tax Assessment Tax Assessment Total Assessment is a certain percentage of the fair market value that is determined by local assessors to be the total taxable value of land and additions on the property. | Land | Improvement |
|---|---|---|---|---|
| 2025 | $7,594 | $717,800 | $290,200 | $427,600 |
| 2024 | $7,552 | $695,400 | $263,800 | $431,600 |
| 2023 | $7,296 | $623,600 | $235,600 | $388,000 |
| 2022 | $6,863 | $525,900 | $188,500 | $337,400 |
| 2021 | $6,482 | $491,400 | $179,000 | $312,400 |
| 2020 | $6,436 | $478,900 | $179,000 | $299,900 |
| 2019 | $6,386 | $450,000 | $169,600 | $280,400 |
| 2018 | $6,235 | $436,900 | $169,600 | $267,300 |
| 2017 | $6,086 | $415,400 | $169,600 | $245,800 |
| 2016 | $6,088 | $411,100 | $169,600 | $241,500 |
Source: Public Records
Map
Nearby Homes
- 10 Evelyn Rd
- 48 Butler St
- 27 Mary Lou St
- 3 Adams Ave
- 159-161 Howe St
- 64-66 Howe St
- Lot 2 Washington St
- 8 Cole St
- 7 Brentwood Ave
- 139 North St
- Lot 108 Garden City Rd
- 25 Carol Ave
- 20 Williams St
- 4 Mulberry Rd
- 55 Phoebe St Unit 32
- 9 Clydesdale Rd
- 40 Phoebe St Unit 101
- 7 Benning St
- 117 Lawrence Rd
- 687 Jackson St
Your Personal Tour Guide
Ask me questions while you tour the home.