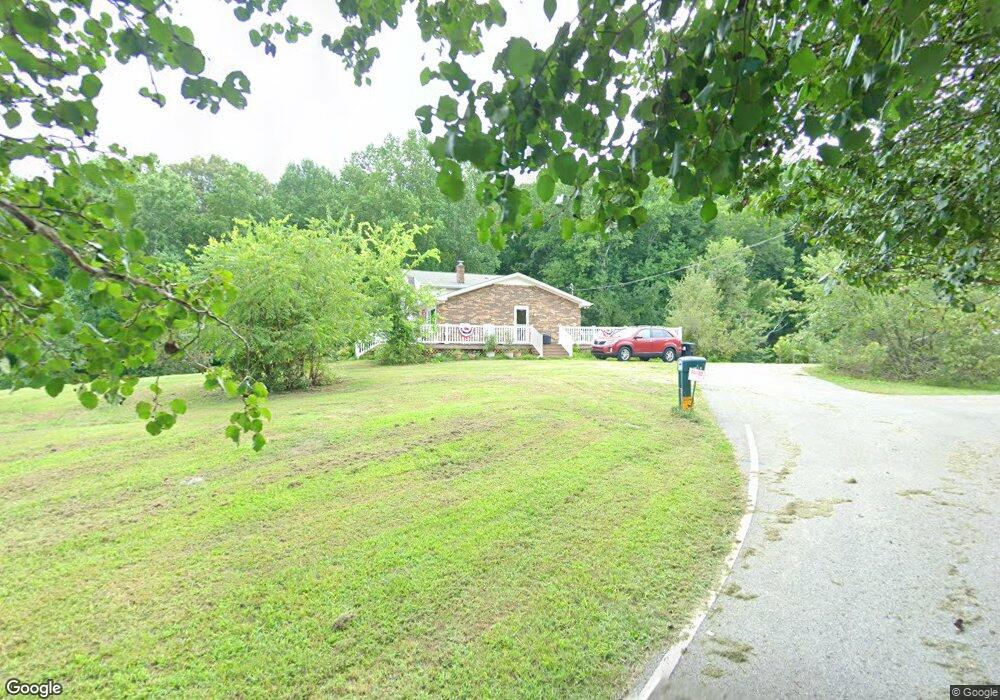
67 Creed Ln Sparta, TN 38583
Estimated Value: $284,113 - $394,000
--
Bed
2
Baths
2,025
Sq Ft
$161/Sq Ft
Est. Value
About This Home
This home is located at 67 Creed Ln, Sparta, TN 38583 and is currently estimated at $325,528, approximately $160 per square foot. 67 Creed Ln is a home located in Van Buren County with nearby schools including Spencer Elementary School and Van Buren County High School.
Ownership History
Date
Name
Owned For
Owner Type
Purchase Details
Closed on
Jul 13, 2005
Sold by
Dekraker James
Bought by
Wagner William P and Wagner Jacquelyn S
Current Estimated Value
Home Financials for this Owner
Home Financials are based on the most recent Mortgage that was taken out on this home.
Original Mortgage
$114,400
Outstanding Balance
$58,186
Interest Rate
5.46%
Mortgage Type
Cash
Estimated Equity
$267,342
Purchase Details
Closed on
Nov 25, 1997
Bought by
Dekraker James and Dekraker Carol
Purchase Details
Closed on
Dec 7, 1992
Bought by
Bradley Curtis and Bradley Martha
Purchase Details
Closed on
Sep 4, 1992
Bought by
Brasel Carl
Purchase Details
Closed on
Oct 8, 1980
Bought by
Vance Ronald D
Purchase Details
Closed on
Jan 2, 1900
Create a Home Valuation Report for This Property
The Home Valuation Report is an in-depth analysis detailing your home's value as well as a comparison with similar homes in the area
Home Values in the Area
Average Home Value in this Area
Purchase History
| Date | Buyer | Sale Price | Title Company |
|---|---|---|---|
| Wagner William P | $143,000 | -- | |
| Dekraker James | $59,900 | -- | |
| Bradley Curtis | $45,000 | -- | |
| Brasel Carl | $89,800 | -- | |
| Vance Ronald D | -- | -- | |
| -- | -- | -- |
Source: Public Records
Mortgage History
| Date | Status | Borrower | Loan Amount |
|---|---|---|---|
| Open | Wagner William P | $114,400 |
Source: Public Records
Tax History Compared to Growth
Tax History
| Year | Tax Paid | Tax Assessment Tax Assessment Total Assessment is a certain percentage of the fair market value that is determined by local assessors to be the total taxable value of land and additions on the property. | Land | Improvement |
|---|---|---|---|---|
| 2025 | $1,124 | $46,825 | $0 | $0 |
| 2024 | $1,124 | $46,825 | $11,475 | $35,350 |
| 2023 | $1,124 | $46,825 | $11,475 | $35,350 |
| 2022 | $1,124 | $46,825 | $11,475 | $35,350 |
| 2021 | $1,124 | $46,825 | $11,475 | $35,350 |
| 2020 | $1,003 | $46,825 | $11,475 | $35,350 |
| 2019 | $840 | $36,350 | $9,100 | $27,250 |
| 2018 | $702 | $36,350 | $9,100 | $27,250 |
| 2017 | $682 | $36,350 | $9,100 | $27,250 |
| 2016 | $682 | $35,325 | $9,100 | $26,225 |
| 2015 | $647 | $35,325 | $9,100 | $26,225 |
| 2014 | $629 | $31,225 | $9,100 | $22,125 |
| 2013 | $629 | $34,349 | $0 | $0 |
Source: Public Records
Map
Nearby Homes
- 177 Hidden River Ave
- 0 Hidden River Ave Unit 1323479
- 0 Cane Creek-Cummingsville Rd
- Lot 1 Rd
- Lot 5 Hwy 285 Cane Creek - Cummingsville Rd
- Lot 4 Hwy 285 Cane Creek - Cummingsville Rd
- 0 Big Bottom Rd Unit RTC2762488
- 1.85 AC Cane Creek-Cummingsville Rd
- 185 Cane Creek-Cummingsville Rd
- 171 Overlook Dr
- 179 River Front Dr
- 253 River Front Dr
- 523 Doctor I C Morgan Rd
- 459 Doctor I C Morgan Rd
- 77 River Front Dr
- 70 River Oaks Dr
- 88 River Oaks Dr
- 263 River Oaks Dr
- 2339 Cane Creek-Cummingsville Rd
- Lot 4 &5 Peaceful Ln
- 54 Creed Ln
- 32 Creed Ln
- 00 Lawson Rd
- LT 7 Lawson Rd
- 805 S Hickory Valley Rd
- 126 Lawson Rd
- 788 Hickory Valley Rd
- 575 Hickory Valley Rd
- 0 Lawson Rd Unit 2023507
- 846 Hickory Valley Rd
- 699 S Hickory Valley Rd
- 1259 River Hill Rd
- 1349 River Hill Rd
- 1034 River Hill Rd
- 195 Wheelbarrow Rd
- 573 S Hickory Valley Rd
- 1260 River Hill Rd
- 983 River Hill Rd
- 449 Hickory Valley Rd
- 455 S Hickory Valley Rd