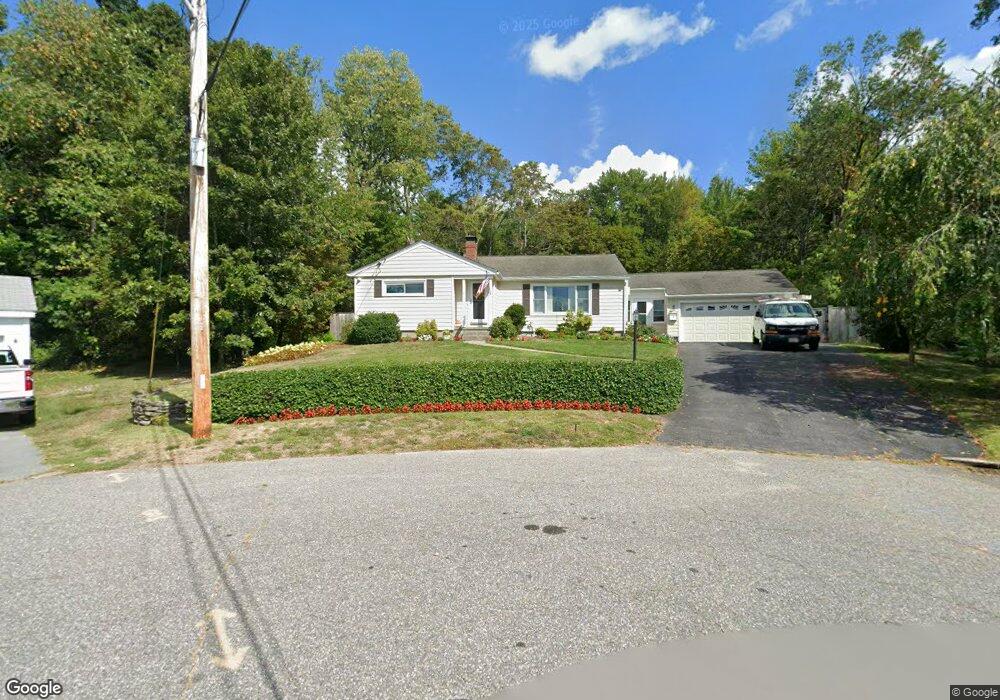
67 Crescent Rd Leominster, MA 01453
Estimated Value: $463,491 - $540,000
3
Beds
1
Bath
1,395
Sq Ft
$361/Sq Ft
Est. Value
About This Home
This home is located at 67 Crescent Rd, Leominster, MA 01453 and is currently estimated at $503,373, approximately $360 per square foot. 67 Crescent Rd is a home located in Worcester County with nearby schools including Leominster High School, St. Leo School, and St. Anna Catholic School.
Ownership History
Date
Name
Owned For
Owner Type
Purchase Details
Closed on
Sep 12, 2003
Sold by
Johnson Donna L and Priest Donna L
Bought by
Johnson Donna L and Johnson Jeffrey C
Current Estimated Value
Purchase Details
Closed on
Aug 11, 1989
Sold by
Dupuis David
Bought by
Priest Donna
Home Financials for this Owner
Home Financials are based on the most recent Mortgage that was taken out on this home.
Original Mortgage
$60,000
Interest Rate
9.93%
Mortgage Type
Purchase Money Mortgage
Create a Home Valuation Report for This Property
The Home Valuation Report is an in-depth analysis detailing your home's value as well as a comparison with similar homes in the area
Home Values in the Area
Average Home Value in this Area
Purchase History
| Date | Buyer | Sale Price | Title Company |
|---|---|---|---|
| Johnson Donna L | -- | -- | |
| Priest Donna | $155,000 | -- |
Source: Public Records
Mortgage History
| Date | Status | Borrower | Loan Amount |
|---|---|---|---|
| Previous Owner | Priest Donna | $60,000 |
Source: Public Records
Tax History
| Year | Tax Paid | Tax Assessment Tax Assessment Total Assessment is a certain percentage of the fair market value that is determined by local assessors to be the total taxable value of land and additions on the property. | Land | Improvement |
|---|---|---|---|---|
| 2025 | $6,107 | $435,300 | $141,400 | $293,900 |
| 2024 | $5,871 | $404,600 | $134,700 | $269,900 |
| 2023 | $5,897 | $379,500 | $117,100 | $262,400 |
| 2022 | $5,668 | $342,300 | $101,800 | $240,500 |
| 2021 | $5,533 | $305,200 | $79,300 | $225,900 |
| 2020 | $5,315 | $295,600 | $79,300 | $216,300 |
| 2019 | $5,124 | $276,400 | $75,500 | $200,900 |
| 2018 | $4,991 | $258,200 | $73,400 | $184,800 |
| 2017 | $4,680 | $237,200 | $68,500 | $168,700 |
| 2016 | $4,488 | $229,200 | $68,500 | $160,700 |
| 2015 | $4,259 | $219,100 | $68,500 | $150,600 |
| 2014 | $3,954 | $209,300 | $75,600 | $133,700 |
Source: Public Records
Map
Nearby Homes
Your Personal Tour Guide
Ask me questions while you tour the home.