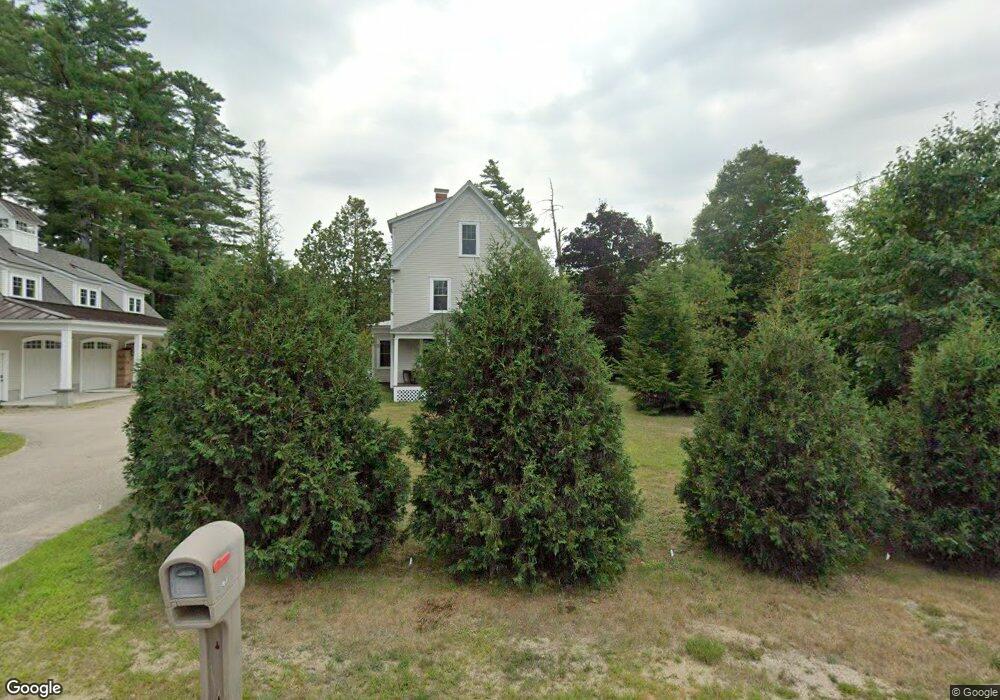
67 Dinsmore Rd Intervale, NH 03845
Estimated Value: $675,797 - $829,000
6
Beds
3
Baths
2,700
Sq Ft
$273/Sq Ft
Est. Value
About This Home
This home is located at 67 Dinsmore Rd, Intervale, NH 03845 and is currently estimated at $735,949, approximately $272 per square foot. 67 Dinsmore Rd is a home located in Carroll County with nearby schools including A. Crosby Kennett Middle School, Kennett High School, and The Lilliputian School.
Ownership History
Date
Name
Owned For
Owner Type
Purchase Details
Closed on
May 30, 2014
Sold by
Armstrong Patrick R and Armstrong Amy R
Bought by
Wolfe 3Rd Francis E
Current Estimated Value
Home Financials for this Owner
Home Financials are based on the most recent Mortgage that was taken out on this home.
Original Mortgage
$200,000
Outstanding Balance
$143,598
Interest Rate
4.26%
Mortgage Type
New Conventional
Estimated Equity
$592,351
Purchase Details
Closed on
Aug 24, 1999
Sold by
Deans Thomas S and Deans Dorcas H
Bought by
Armstrong Patrick R
Home Financials for this Owner
Home Financials are based on the most recent Mortgage that was taken out on this home.
Original Mortgage
$112,000
Interest Rate
7.6%
Mortgage Type
Purchase Money Mortgage
Create a Home Valuation Report for This Property
The Home Valuation Report is an in-depth analysis detailing your home's value as well as a comparison with similar homes in the area
Home Values in the Area
Average Home Value in this Area
Purchase History
| Date | Buyer | Sale Price | Title Company |
|---|---|---|---|
| Wolfe 3Rd Francis E | $250,000 | -- | |
| Wolfe 3Rd Francis E | $250,000 | -- | |
| Armstrong Patrick R | $140,000 | -- | |
| Armstrong Patrick R | $140,000 | -- |
Source: Public Records
Mortgage History
| Date | Status | Borrower | Loan Amount |
|---|---|---|---|
| Open | Armstrong Patrick R | $200,000 | |
| Closed | Armstrong Patrick R | $200,000 | |
| Previous Owner | Armstrong Patrick R | $112,000 |
Source: Public Records
Tax History
| Year | Tax Paid | Tax Assessment Tax Assessment Total Assessment is a certain percentage of the fair market value that is determined by local assessors to be the total taxable value of land and additions on the property. | Land | Improvement |
|---|---|---|---|---|
| 2024 | $9,096 | $721,900 | $165,500 | $556,400 |
| 2023 | $8,390 | $732,100 | $165,500 | $566,600 |
| 2022 | $7,169 | $373,800 | $81,700 | $292,100 |
| 2021 | $5,353 | $327,600 | $81,700 | $245,900 |
| 2020 | $5,814 | $311,400 | $81,700 | $229,700 |
| 2019 | $5,393 | $311,400 | $81,700 | $229,700 |
| 2018 | $5,433 | $245,500 | $61,700 | $183,800 |
| 2017 | $4,905 | $245,500 | $61,700 | $183,800 |
| 2016 | $4,741 | $245,500 | $61,700 | $183,800 |
| 2015 | $4,687 | $245,500 | $61,700 | $183,800 |
| 2014 | $4,624 | $245,200 | $61,700 | $183,500 |
| 2013 | $4,547 | $254,600 | $61,700 | $192,900 |
Source: Public Records
Map
Nearby Homes
- 46 Crestwood Dr
- 49 Neighbors Row
- 00000 Ledgewood Rd Unit 249
- 136 Northbrook Cir Unit 96
- 16 Purple Finch Rd Unit I71
- 17 Purple Finch Rd Unit 73
- 45 Wildflower Trail Unit 9
- 28 Washington Ave
- 227 Alpstrausse
- 2955 White Mountain Hwy Unit 114 (W25)
- 2955 White Mountain Hwy Unit 214 (W50)
- 2955 White Mountain Hwy Unit 201-202 W26
- 3002 White Mountain Hwy Unit Lots 29 and 30 - 300
- 970 Kearsarge Rd
- 32 Mount Surprise Rd
- 2906 White Mountain Hwy
- D37 Eagle Ridge Rd Unit D37
- 135 Nh Rte 16 and 302 Hwy
- 127 New Hampshire 16a
- 50 Drachenfels Rd
- 73 Dinsmore Rd
- 50 Dinsmore Rd
- 83 Dinsmore Rd
- 64 Dinsmore Rd
- 415 Intervale Cross Rd
- 142 Intervale Cross Rd
- 515 Intervale Crossroad
- 95 Dinsmore Rd
- 163 Intervale Crossroad
- 170 Intervale Cross Rd
- 88 Dinsmore Rd
- 124 Intervale Cross Rd Unit 7D
- 38 Dinsmore Rd
- 180 Intervale Cross Rd
- 237 Intervale Crossroad
- 180 Intervale Cross Rd
- 158 Intervale Cross Rd
- 19 Cross
- 55 Wyman Ave
- 0 Intervale Crossroad Unit 4179107
Your Personal Tour Guide
Ask me questions while you tour the home.