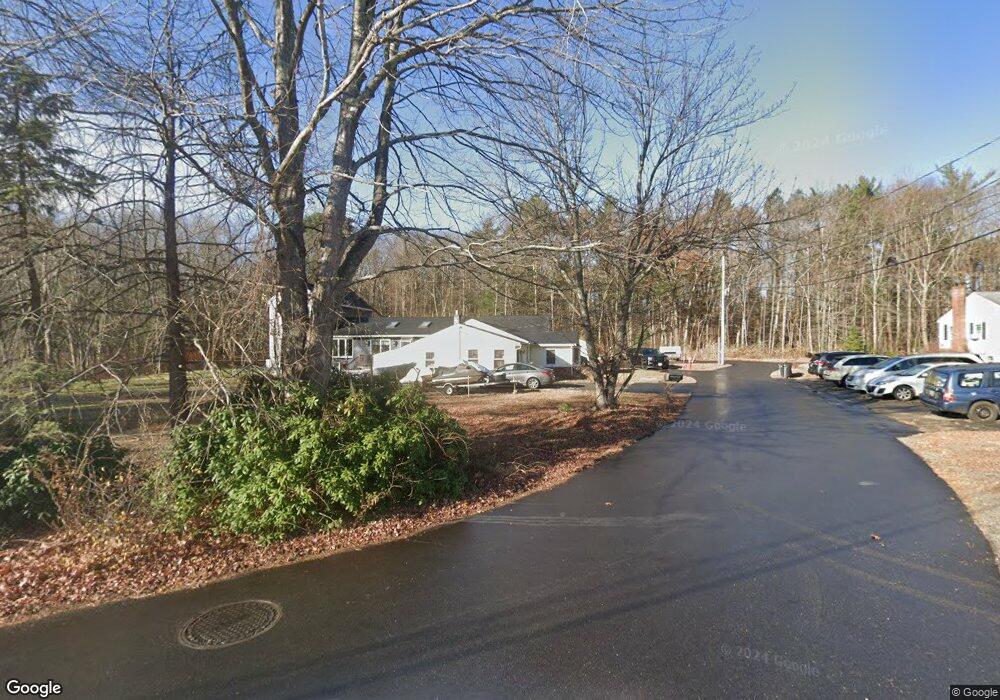
67 Dows Ln Seabrook, NH 03874
Estimated Value: $675,000 - $741,641
5
Beds
4
Baths
3,294
Sq Ft
$216/Sq Ft
Est. Value
About This Home
This home is located at 67 Dows Ln, Seabrook, NH 03874 and is currently estimated at $710,660, approximately $215 per square foot. 67 Dows Ln is a home located in Rockingham County with nearby schools including Seabrook Elementary School, Seabrook Middle School, and Winnacunnet High School.
Ownership History
Date
Name
Owned For
Owner Type
Purchase Details
Closed on
Aug 21, 2025
Sold by
Edwards
Bought by
Edwards William J
Current Estimated Value
Home Financials for this Owner
Home Financials are based on the most recent Mortgage that was taken out on this home.
Original Mortgage
$361,212
Outstanding Balance
$360,899
Interest Rate
6.72%
Mortgage Type
FHA
Estimated Equity
$349,761
Purchase Details
Closed on
Nov 3, 2023
Sold by
Edwards
Bought by
Edwards
Purchase Details
Closed on
Dec 22, 2016
Sold by
Edwards William J and Edwards Shannon R
Bought by
Edwards
Home Financials for this Owner
Home Financials are based on the most recent Mortgage that was taken out on this home.
Original Mortgage
$333,600
Interest Rate
2.88%
Mortgage Type
New Conventional
Purchase Details
Closed on
May 30, 2014
Sold by
Edwards William J
Bought by
Edwards
Purchase Details
Closed on
Feb 7, 2014
Sold by
Edward Margaret F and Edwards William J
Bought by
Edwards William J
Create a Home Valuation Report for This Property
The Home Valuation Report is an in-depth analysis detailing your home's value as well as a comparison with similar homes in the area
Home Values in the Area
Average Home Value in this Area
Purchase History
| Date | Buyer | Sale Price | Title Company |
|---|---|---|---|
| Edwards William J | -- | -- | |
| Edwards William J | -- | -- | |
| Edwards William J | -- | -- | |
| Edwards | -- | None Available | |
| Edwards | -- | None Available | |
| Edwards | -- | None Available | |
| Edwards | -- | -- | |
| Edwards | -- | -- | |
| Edwards William J | -- | -- | |
| Edwards William J | -- | -- | |
| Edwards | -- | -- | |
| Edwards | -- | -- | |
| Edwards | -- | -- | |
| Edwards William J | -- | -- | |
| Edwards William J | -- | -- | |
| Edwards William J | -- | -- |
Source: Public Records
Mortgage History
| Date | Status | Borrower | Loan Amount |
|---|---|---|---|
| Open | Edwards William J | $361,212 | |
| Closed | Edwards William J | $361,212 | |
| Previous Owner | Edwards | $333,600 | |
| Previous Owner | Edwards William J | $390,000 |
Source: Public Records
Tax History Compared to Growth
Tax History
| Year | Tax Paid | Tax Assessment Tax Assessment Total Assessment is a certain percentage of the fair market value that is determined by local assessors to be the total taxable value of land and additions on the property. | Land | Improvement |
|---|---|---|---|---|
| 2024 | $7,173 | $612,000 | $221,100 | $390,900 |
| 2023 | $7,762 | $514,400 | $176,500 | $337,900 |
| 2022 | $6,816 | $514,400 | $176,500 | $337,900 |
| 2021 | $6,704 | $488,300 | $160,500 | $327,800 |
| 2020 | $5,832 | $321,100 | $128,400 | $192,700 |
| 2019 | $5,131 | $325,800 | $128,400 | $197,400 |
| 2018 | $4,951 | $304,700 | $117,600 | $187,100 |
| 2017 | $5,797 | $285,100 | $98,000 | $187,100 |
| 2016 | $4,217 | $285,100 | $98,000 | $187,100 |
| 2015 | $3,891 | $263,100 | $92,000 | $171,100 |
| 2014 | $4,033 | $264,100 | $92,000 | $172,100 |
| 2013 | $4,033 | $264,100 | $92,000 | $172,100 |
Source: Public Records
Map
Nearby Homes
- 22 Farm Ln
- 8 Kimberly Dr
- 38 Rocks Rd Unit 2
- 38 Rocks Rd Unit 1
- 20 Railroad Ave
- 14 Coleman Ct
- 81 Elm Ct
- 57 Washington St
- 46 Kensington Rd
- 176 Lower Collins St
- 28 Brooks Rd
- 51 Depot Rd
- 35 Norman Rd
- 241 & 245 Lafayette Rd
- 106 Folly Mill Rd
- 1 Old Salt Dr
- 2 Collins St
- 213 New Hampshire 107
- 27 Cross Beach Rd
- 18 River St