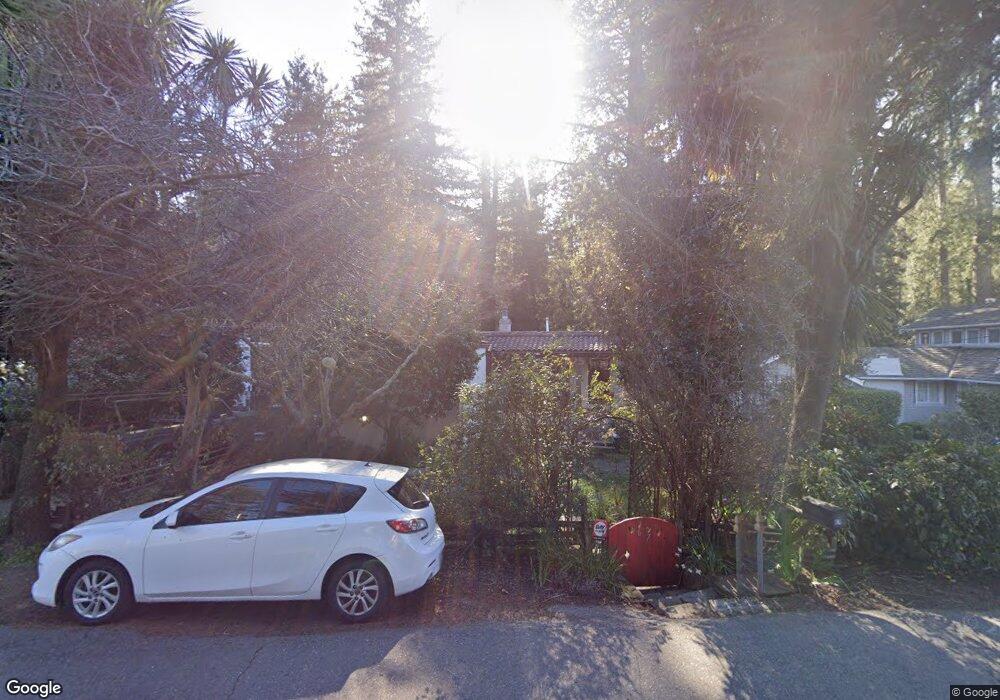
67 Duncan Way Oakland, CA 94611
Glen Highlands NeighborhoodEstimated Value: $1,070,000 - $1,241,000
2
Beds
2
Baths
1,609
Sq Ft
$718/Sq Ft
Est. Value
About This Home
This home is located at 67 Duncan Way, Oakland, CA 94611 and is currently estimated at $1,154,637, approximately $717 per square foot. 67 Duncan Way is a home located in Alameda County with nearby schools including Thornhill Elementary School, Montera Middle School, and Skyline High School.
Ownership History
Date
Name
Owned For
Owner Type
Purchase Details
Closed on
Jan 30, 2017
Sold by
Abbott Kim V and Anderson Elizabeth
Bought by
Abbott Kim V and Anderson Elizabeth
Current Estimated Value
Home Financials for this Owner
Home Financials are based on the most recent Mortgage that was taken out on this home.
Original Mortgage
$600,592
Interest Rate
3%
Mortgage Type
Adjustable Rate Mortgage/ARM
Purchase Details
Closed on
Feb 18, 2003
Sold by
Abbott Kim V
Bought by
Anderson Abbott Kim V and Anderson Abbott Elizabeth
Home Financials for this Owner
Home Financials are based on the most recent Mortgage that was taken out on this home.
Original Mortgage
$240,000
Interest Rate
5.95%
Create a Home Valuation Report for This Property
The Home Valuation Report is an in-depth analysis detailing your home's value as well as a comparison with similar homes in the area
Home Values in the Area
Average Home Value in this Area
Purchase History
| Date | Buyer | Sale Price | Title Company |
|---|---|---|---|
| Abbott Kim V | -- | Placer Title Company | |
| Anderson Abbott Kim V | -- | Financial Title Company | |
| Abbott Kim V | -- | Financial Title Company |
Source: Public Records
Mortgage History
| Date | Status | Borrower | Loan Amount |
|---|---|---|---|
| Closed | Abbott Kim V | $600,592 | |
| Closed | Abbott Kim V | $240,000 |
Source: Public Records
Tax History Compared to Growth
Tax History
| Year | Tax Paid | Tax Assessment Tax Assessment Total Assessment is a certain percentage of the fair market value that is determined by local assessors to be the total taxable value of land and additions on the property. | Land | Improvement |
|---|---|---|---|---|
| 2025 | $6,258 | $349,568 | $260,425 | $96,143 |
| 2024 | $6,258 | $342,577 | $255,319 | $94,258 |
| 2023 | $6,490 | $342,723 | $250,313 | $92,410 |
| 2022 | $6,277 | $329,004 | $245,406 | $90,598 |
| 2021 | $5,923 | $322,416 | $240,594 | $88,822 |
| 2020 | $5,854 | $326,039 | $238,128 | $87,911 |
| 2019 | $5,584 | $319,648 | $233,460 | $86,188 |
| 2018 | $5,466 | $313,381 | $228,883 | $84,498 |
| 2017 | $5,238 | $307,237 | $224,395 | $82,842 |
| 2016 | $5,016 | $301,213 | $219,996 | $81,217 |
| 2015 | $4,985 | $296,690 | $216,692 | $79,998 |
| 2014 | $4,936 | $290,880 | $212,449 | $78,431 |
Source: Public Records
Map
Nearby Homes
- 0 3 Ascot Dr Unit 425041613
- 0 0 Ascot Dr Unit 425040144
- 196 Glenwood Glade
- 164 Duncan Way
- 209 Sheridan Rd
- 164 Sheridan Rd
- 5673 Florence Terrace
- 9047 Broadway Terrace
- 110 Sheridan Rd
- 373 Taurus Ave
- 4914 Proctor Ave
- 641 Mountain Blvd
- 0 Gouldin Rd Unit 41077349
- 6257 Virgo Rd
- 5716 Merriewood Dr
- 5621 Maxwelton Rd
- 100 Sonia St
- 0 Sheridan Rd
- 135 Alta Rd
- 5630 Moraga Ave
- 75 Duncan Way
- 59 Duncan Way
- 101 Duncan Way
- 136 Glenwood Glade
- 144 Glenwood Glade
- 6689 Thorndale Dr
- 8886 Lauriston Ct
- 8888 Lauriston Ct
- 6658 Shepherd Canyon Rd
- 8 Bishop Ct
- 1061 Leo Way
- 152 Glenwood Glade
- 126 Glenwood Glade
- 1047 Leo Way
- 43 Duncan Way
- 162 Glenwood Glade
- 109 Duncan Way
- 36 Duncan Way
- 120 Glenwood Glade
- 172 Glenwood Glade