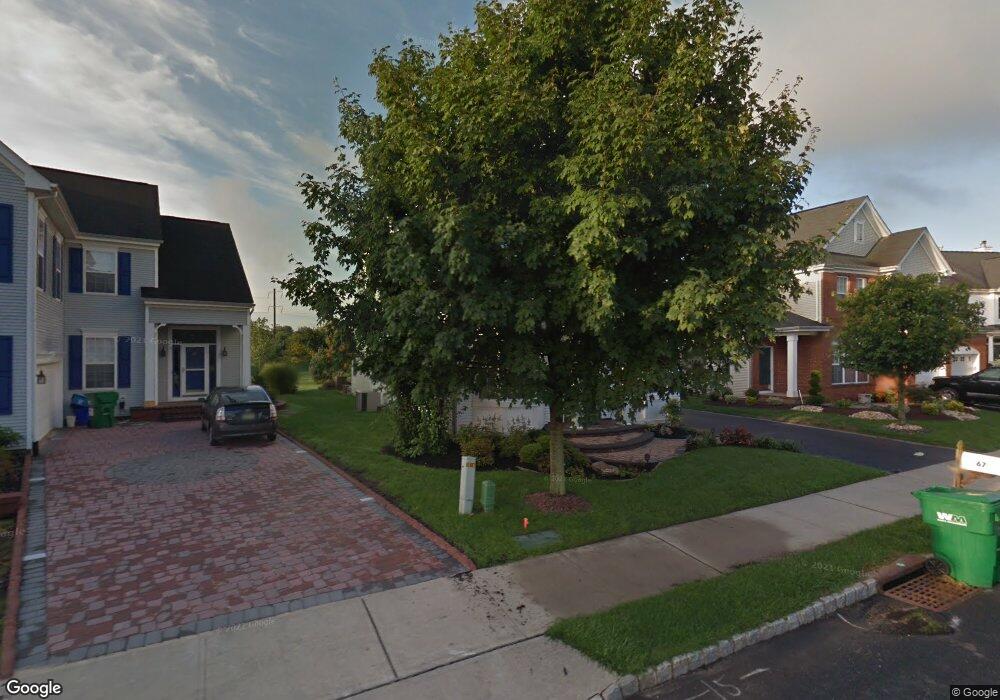
67 Elsie Dr Plainsboro, NJ 08536
Estimated Value: $1,007,961 - $1,104,000
--
Bed
--
Bath
2,283
Sq Ft
$463/Sq Ft
Est. Value
About This Home
This home is located at 67 Elsie Dr, Plainsboro, NJ 08536 and is currently estimated at $1,056,740, approximately $462 per square foot. 67 Elsie Dr is a home located in Middlesex County with nearby schools including Town Center Elementary School, Millstone River School, and Thomas R. Grover Middle School.
Ownership History
Date
Name
Owned For
Owner Type
Purchase Details
Closed on
Mar 31, 2004
Sold by
Guadalupe Daniel R
Bought by
Schnitzer Jay and Schnitzer Ginger Gold
Current Estimated Value
Home Financials for this Owner
Home Financials are based on the most recent Mortgage that was taken out on this home.
Original Mortgage
$256,500
Outstanding Balance
$118,428
Interest Rate
5.39%
Estimated Equity
$938,312
Purchase Details
Closed on
Sep 10, 1999
Sold by
Baker Residential
Bought by
Guadalupe Daniel and Maldonado Aramilys
Home Financials for this Owner
Home Financials are based on the most recent Mortgage that was taken out on this home.
Original Mortgage
$240,000
Interest Rate
7.81%
Create a Home Valuation Report for This Property
The Home Valuation Report is an in-depth analysis detailing your home's value as well as a comparison with similar homes in the area
Home Values in the Area
Average Home Value in this Area
Purchase History
| Date | Buyer | Sale Price | Title Company |
|---|---|---|---|
| Schnitzer Jay | $456,500 | -- | |
| Guadalupe Daniel | $267,595 | -- |
Source: Public Records
Mortgage History
| Date | Status | Borrower | Loan Amount |
|---|---|---|---|
| Open | Schnitzer Jay | $256,500 | |
| Previous Owner | Guadalupe Daniel | $240,000 |
Source: Public Records
Tax History Compared to Growth
Tax History
| Year | Tax Paid | Tax Assessment Tax Assessment Total Assessment is a certain percentage of the fair market value that is determined by local assessors to be the total taxable value of land and additions on the property. | Land | Improvement |
|---|---|---|---|---|
| 2025 | $17,805 | $681,400 | $238,400 | $443,000 |
| 2024 | $17,376 | $681,400 | $238,400 | $443,000 |
| 2023 | $17,376 | $681,400 | $238,400 | $443,000 |
| 2022 | $17,110 | $681,400 | $238,400 | $443,000 |
| 2021 | $15,938 | $681,400 | $238,400 | $443,000 |
| 2020 | $16,299 | $681,400 | $238,400 | $443,000 |
| 2019 | $15,938 | $681,400 | $238,400 | $443,000 |
| 2018 | $15,584 | $681,400 | $238,400 | $443,000 |
| 2017 | $15,141 | $681,400 | $238,400 | $443,000 |
| 2016 | $14,473 | $681,400 | $238,400 | $443,000 |
| 2015 | $12,951 | $513,100 | $194,400 | $318,700 |
| 2014 | $12,822 | $513,100 | $194,400 | $318,700 |
Source: Public Records
Map
Nearby Homes