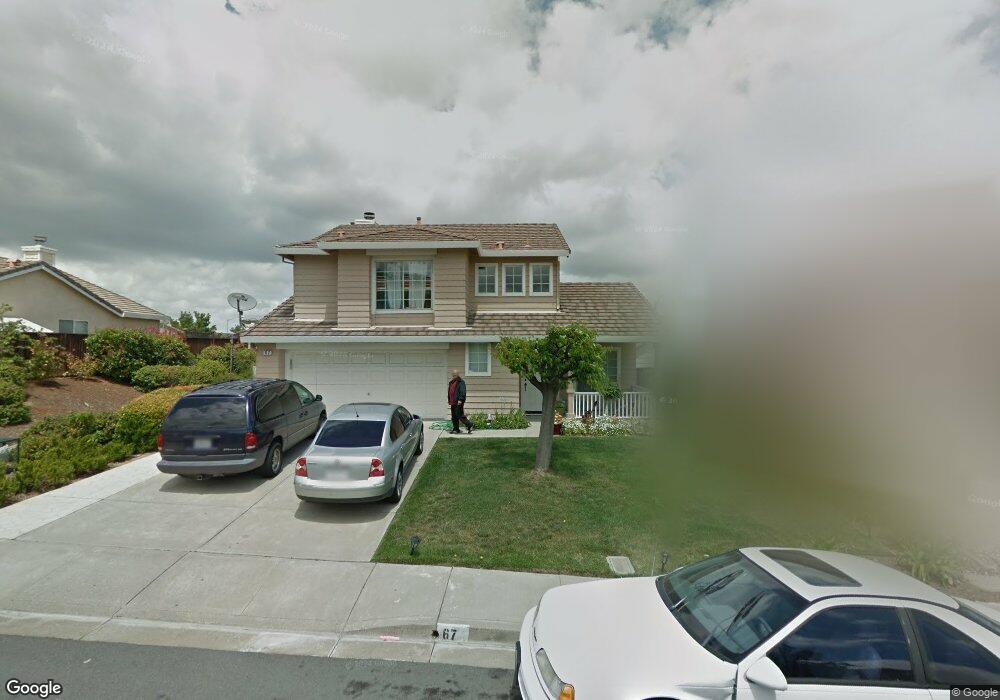
67 Fletcher Ct Bay Point, CA 94565
Estimated Value: $517,000 - $707,000
3
Beds
3
Baths
1,426
Sq Ft
$434/Sq Ft
Est. Value
About This Home
This home is located at 67 Fletcher Ct, Bay Point, CA 94565 and is currently estimated at $619,081, approximately $434 per square foot. 67 Fletcher Ct is a home located in Contra Costa County with nearby schools including Shore Acres Elementary School, Riverview Middle School, and Mt. Diablo High School.
Ownership History
Date
Name
Owned For
Owner Type
Purchase Details
Closed on
Jul 31, 2003
Sold by
Cendant Mobility Financial Corp
Bought by
Diaz Suriel and Diaz Cristina B
Current Estimated Value
Home Financials for this Owner
Home Financials are based on the most recent Mortgage that was taken out on this home.
Original Mortgage
$292,000
Outstanding Balance
$122,766
Interest Rate
5%
Mortgage Type
Purchase Money Mortgage
Estimated Equity
$496,315
Purchase Details
Closed on
Jul 25, 2003
Sold by
Morgan John A and Morgan Carrie M
Bought by
Cendant Mobility Financial Corp
Home Financials for this Owner
Home Financials are based on the most recent Mortgage that was taken out on this home.
Original Mortgage
$292,000
Outstanding Balance
$122,766
Interest Rate
5%
Mortgage Type
Purchase Money Mortgage
Estimated Equity
$496,315
Purchase Details
Closed on
May 12, 1995
Sold by
Kaufman & Broad Of Northern California
Bought by
Morgan John A and Morgan Carrie M
Home Financials for this Owner
Home Financials are based on the most recent Mortgage that was taken out on this home.
Original Mortgage
$176,000
Interest Rate
8.51%
Mortgage Type
Purchase Money Mortgage
Create a Home Valuation Report for This Property
The Home Valuation Report is an in-depth analysis detailing your home's value as well as a comparison with similar homes in the area
Home Values in the Area
Average Home Value in this Area
Purchase History
We collect this data history from publicly available records. To have your information removed, we recommend requesting removal directly through your county’s website.
| Date | Buyer | Sale Price | Title Company |
|---|---|---|---|
| Diaz Suriel | $323,000 | First American Title | |
| Cendant Mobility Financial Corp | $323,000 | First American Title | |
| Morgan John A | $185,500 | First American Title Guarant |
Source: Public Records
Mortgage History
We collect this data history from publicly available records. To have your information removed, we recommend requesting removal directly through your county’s website.
| Date | Status | Borrower | Loan Amount |
|---|---|---|---|
| Open | Diaz Suriel | $292,000 | |
| Previous Owner | Morgan John A | $176,000 | |
| Closed | Diaz Suriel | $36,500 |
Source: Public Records
Tax History
| Year | Tax Paid | Tax Assessment Tax Assessment Total Assessment is a certain percentage of the fair market value that is determined by local assessors to be the total taxable value of land and additions on the property. | Land | Improvement |
|---|---|---|---|---|
| 2025 | $7,268 | $523,227 | $177,715 | $345,512 |
| 2024 | $7,075 | $512,969 | $174,231 | $338,738 |
| 2023 | $6,942 | $502,912 | $170,815 | $332,097 |
| 2022 | $6,875 | $493,052 | $167,466 | $325,586 |
| 2021 | $6,712 | $483,385 | $164,183 | $319,202 |
| 2019 | $6,556 | $469,049 | $159,314 | $309,735 |
| 2018 | $6,335 | $459,853 | $156,191 | $303,662 |
| 2017 | $5,983 | $436,000 | $148,090 | $287,910 |
| 2016 | $5,576 | $404,500 | $137,391 | $267,109 |
| 2015 | $5,137 | $363,500 | $123,465 | $240,035 |
| 2014 | $4,995 | $350,500 | $119,049 | $231,451 |
Source: Public Records
Map
Nearby Homes
- 63 Fletcher Ct
- 71 Fletcher Ct
- 544 Burdick Dr
- 59 Fletcher Ct
- 540 Burdick Dr
- 548 Burdick Dr
- 75 Fletcher Ct
- 66 Fletcher Ct
- 536 Burdick Dr
- 70 Fletcher Ct
- 62 Fletcher Ct
- 583 Fletcher St
- 552 Burdick Dr
- 532 Burdick Dr
- 652 Corliss St
- 579 Fletcher St
- 556 Burdick Dr
- 582 Fletcher St
- 528 Burdick Dr
- 545 Burdick Dr
Your Personal Tour Guide
Ask me questions while you tour the home.