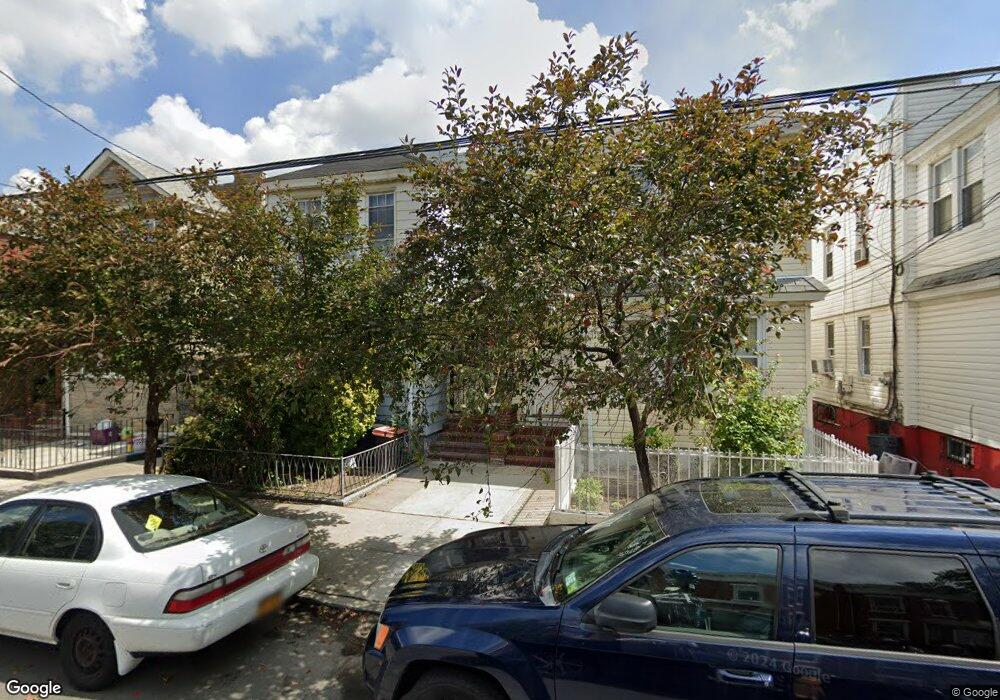
67 Forbell St Brooklyn, NY 11208
East New York NeighborhoodEstimated Value: $769,981 - $1,073,000
--
Bed
--
Bath
2,004
Sq Ft
$469/Sq Ft
Est. Value
About This Home
This home is located at 67 Forbell St, Brooklyn, NY 11208 and is currently estimated at $940,495, approximately $469 per square foot. 67 Forbell St is a home located in Kings County with nearby schools including P.S. 214 - Michael Friedsam, Cypress Hills Ascend Charter Lower School, and Blessed Sacrament School.
Ownership History
Date
Name
Owned For
Owner Type
Purchase Details
Closed on
Feb 18, 1999
Sold by
Peacefully Inc
Bought by
Dejesus Juan and Dejesus Maria
Current Estimated Value
Home Financials for this Owner
Home Financials are based on the most recent Mortgage that was taken out on this home.
Original Mortgage
$246,422
Interest Rate
6.78%
Mortgage Type
FHA
Purchase Details
Closed on
Sep 23, 1998
Sold by
Citibank Na
Bought by
Peacefully Inc
Purchase Details
Closed on
May 7, 1998
Sold by
Barcenes Hector
Bought by
Citibank Na
Create a Home Valuation Report for This Property
The Home Valuation Report is an in-depth analysis detailing your home's value as well as a comparison with similar homes in the area
Home Values in the Area
Average Home Value in this Area
Purchase History
| Date | Buyer | Sale Price | Title Company |
|---|---|---|---|
| Dejesus Juan | $253,000 | Nations Title Insurance | |
| Peacefully Inc | $165,000 | -- | |
| Citibank Na | $130,000 | -- |
Source: Public Records
Mortgage History
| Date | Status | Borrower | Loan Amount |
|---|---|---|---|
| Previous Owner | Dejesus Juan | $246,422 |
Source: Public Records
Tax History Compared to Growth
Tax History
| Year | Tax Paid | Tax Assessment Tax Assessment Total Assessment is a certain percentage of the fair market value that is determined by local assessors to be the total taxable value of land and additions on the property. | Land | Improvement |
|---|---|---|---|---|
| 2025 | $6,861 | $52,800 | $16,200 | $36,600 |
| 2024 | $6,861 | $50,340 | $16,200 | $34,140 |
| 2023 | $4,193 | $47,400 | $16,200 | $31,200 |
| 2022 | $4,047 | $46,260 | $16,200 | $30,060 |
| 2021 | $4,358 | $46,080 | $16,200 | $29,880 |
| 2020 | $3,269 | $36,840 | $16,200 | $20,640 |
| 2019 | $5,955 | $36,840 | $16,200 | $20,640 |
| 2018 | $5,475 | $26,856 | $12,290 | $14,566 |
| 2017 | $5,445 | $26,712 | $15,645 | $11,067 |
| 2016 | $5,312 | $26,572 | $13,666 | $12,906 |
| 2015 | $3,039 | $25,145 | $14,849 | $10,296 |
| 2014 | $3,039 | $23,722 | $15,885 | $7,837 |
Source: Public Records
Map
Nearby Homes