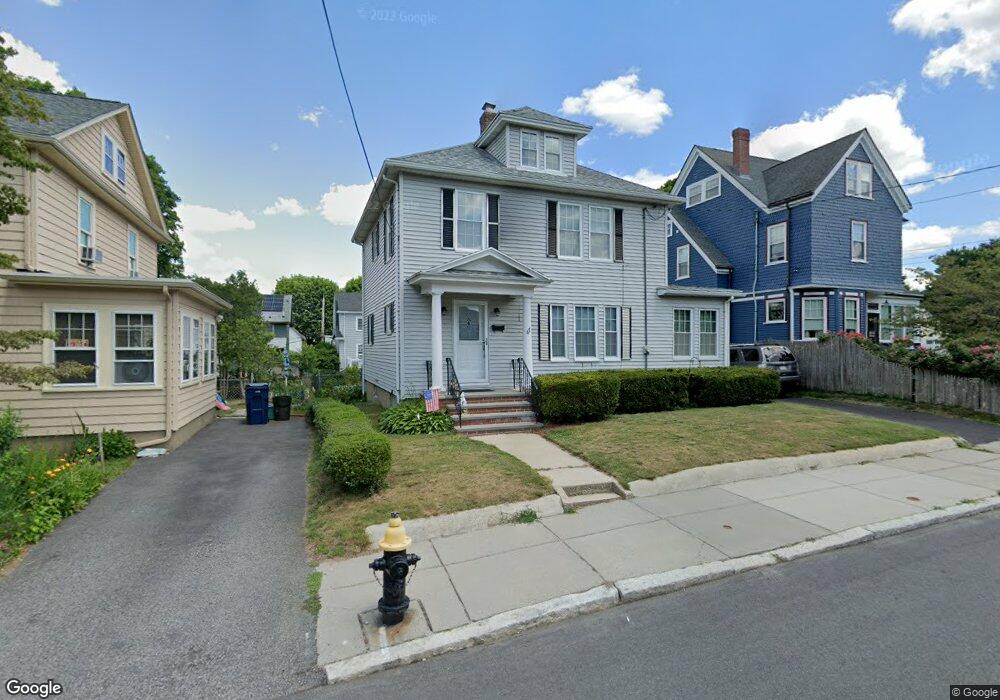
67 Garnet Rd West Roxbury, MA 02132
West Roxbury NeighborhoodEstimated Value: $815,062 - $965,000
3
Beds
1
Bath
1,528
Sq Ft
$574/Sq Ft
Est. Value
About This Home
This home is located at 67 Garnet Rd, West Roxbury, MA 02132 and is currently estimated at $877,766, approximately $574 per square foot. 67 Garnet Rd is a home located in Suffolk County with nearby schools including Holy Name Parish School, St Theresa School, and The Roxbury Latin School.
Ownership History
Date
Name
Owned For
Owner Type
Purchase Details
Closed on
Apr 10, 2025
Sold by
Campbell Stephen G and Campbell Mary L
Bought by
Campbell
Current Estimated Value
Create a Home Valuation Report for This Property
The Home Valuation Report is an in-depth analysis detailing your home's value as well as a comparison with similar homes in the area
Home Values in the Area
Average Home Value in this Area
Purchase History
| Date | Buyer | Sale Price | Title Company |
|---|---|---|---|
| Campbell | -- | None Available | |
| Campbell | -- | None Available |
Source: Public Records
Tax History Compared to Growth
Tax History
| Year | Tax Paid | Tax Assessment Tax Assessment Total Assessment is a certain percentage of the fair market value that is determined by local assessors to be the total taxable value of land and additions on the property. | Land | Improvement |
|---|---|---|---|---|
| 2025 | $7,994 | $690,300 | $237,400 | $452,900 |
| 2024 | $6,996 | $641,800 | $229,100 | $412,700 |
| 2023 | $6,501 | $605,300 | $216,100 | $389,200 |
| 2022 | $5,987 | $550,300 | $196,500 | $353,800 |
| 2021 | $5,471 | $512,700 | $188,900 | $323,800 |
| 2020 | $5,189 | $491,400 | $171,400 | $320,000 |
| 2019 | $4,819 | $457,200 | $147,600 | $309,600 |
| 2018 | $4,608 | $439,700 | $147,600 | $292,100 |
| 2017 | $4,609 | $435,200 | $147,600 | $287,600 |
| 2016 | $4,474 | $406,700 | $147,600 | $259,100 |
| 2015 | $4,630 | $382,300 | $163,400 | $218,900 |
| 2014 | $4,541 | $361,000 | $167,700 | $193,300 |
Source: Public Records
Map
Nearby Homes
- 168 Maple St
- 701 Vfw Pkwy
- 19 Pomfret St
- 37 Pomfret St
- 10 Burwell Rd
- 55 Redlands Rd
- 76 Vermont St
- 173 South St
- 72 Wallis Rd
- 1789 Centre St Unit 202
- 143 South St
- 37 Hastings St Unit 103
- 170 Payson Rd
- 50-56 Broadlawn Park Unit 221
- 23 Westgate Rd Unit 6
- 21 Westgate Rd Unit 6
- 42 Bryon Rd Unit 6
- 845 Lagrange St Unit 4
- 865 Lagrange St Unit 5
- 139 Newfield St