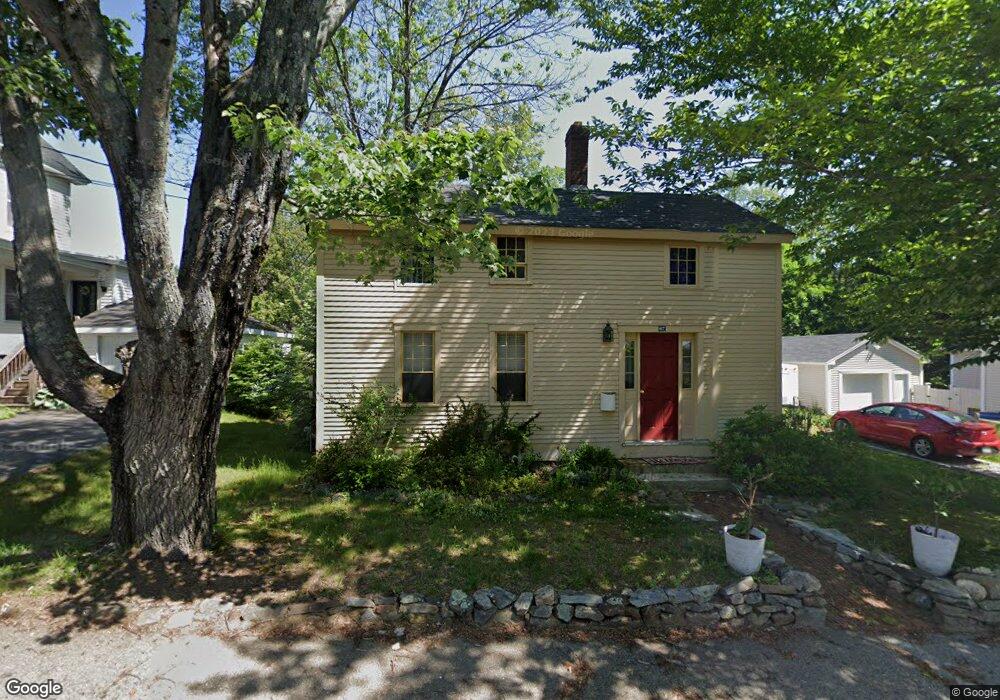
67 High St Tilton, NH 03276
Tilton NeighborhoodEstimated Value: $325,000 - $407,000
2
Beds
2
Baths
1,458
Sq Ft
$242/Sq Ft
Est. Value
About This Home
This home is located at 67 High St, Tilton, NH 03276 and is currently estimated at $352,330, approximately $241 per square foot. 67 High St is a home located in Belknap County with nearby schools including Southwick School, Winnisquam Regional Middle School, and Winnisquam Regional High School.
Ownership History
Date
Name
Owned For
Owner Type
Purchase Details
Closed on
Jan 14, 2002
Sold by
Powers Jon A
Bought by
Pitzer Roger J
Current Estimated Value
Home Financials for this Owner
Home Financials are based on the most recent Mortgage that was taken out on this home.
Original Mortgage
$91,200
Outstanding Balance
$35,693
Interest Rate
7.04%
Estimated Equity
$316,637
Create a Home Valuation Report for This Property
The Home Valuation Report is an in-depth analysis detailing your home's value as well as a comparison with similar homes in the area
Home Values in the Area
Average Home Value in this Area
Purchase History
| Date | Buyer | Sale Price | Title Company |
|---|---|---|---|
| Pitzer Roger J | $116,900 | -- |
Source: Public Records
Mortgage History
| Date | Status | Borrower | Loan Amount |
|---|---|---|---|
| Open | Pitzer Roger J | $57,465 | |
| Open | Pitzer Roger J | $91,200 |
Source: Public Records
Tax History
| Year | Tax Paid | Tax Assessment Tax Assessment Total Assessment is a certain percentage of the fair market value that is determined by local assessors to be the total taxable value of land and additions on the property. | Land | Improvement |
|---|---|---|---|---|
| 2025 | $3,067 | $271,700 | $92,900 | $178,800 |
| 2024 | $2,934 | $271,700 | $92,900 | $178,800 |
| 2023 | $2,579 | $145,600 | $36,700 | $108,900 |
| 2022 | $2,340 | $145,600 | $36,700 | $108,900 |
| 2021 | $2,382 | $145,600 | $36,700 | $108,900 |
| 2020 | $2,689 | $145,600 | $36,700 | $108,900 |
| 2019 | $2,855 | $145,600 | $36,700 | $108,900 |
| 2018 | $2,674 | $114,100 | $34,200 | $79,900 |
| 2017 | $2,632 | $114,100 | $34,200 | $79,900 |
| 2016 | $2,410 | $116,300 | $34,200 | $82,100 |
| 2015 | $2,671 | $116,300 | $34,200 | $82,100 |
| 2014 | $2,316 | $116,300 | $34,200 | $82,100 |
| 2013 | $1,931 | $105,500 | $24,400 | $81,100 |
| 2012 | $1,925 | $105,500 | $24,400 | $81,100 |
Source: Public Records
Map
Nearby Homes
- 8 West St
- 67 Park St
- 124 E Main St
- 24 Morrison Ave
- R02-13 Calef Hill Rd
- 495 W Main St
- 9 Aspen Rd
- 24 Pine Hill Rd
- 5 Greenwood Dr
- 20 Timberline Dr
- 12 Stonehenge Cir
- 14 Stonehenge Cir Unit 11
- 12 Village Way Unit 38
- 22 Stonehenge Cir Unit 7
- 11 Stonehenge Cir Unit 2
- 15 Millstone Dr Unit 15
- 41 Village Way Unit 22
- 9 Stonehenge Cir Unit 1
- 10 Woodlawn Ave
- 48 Millstone Dr Unit 58
Your Personal Tour Guide
Ask me questions while you tour the home.