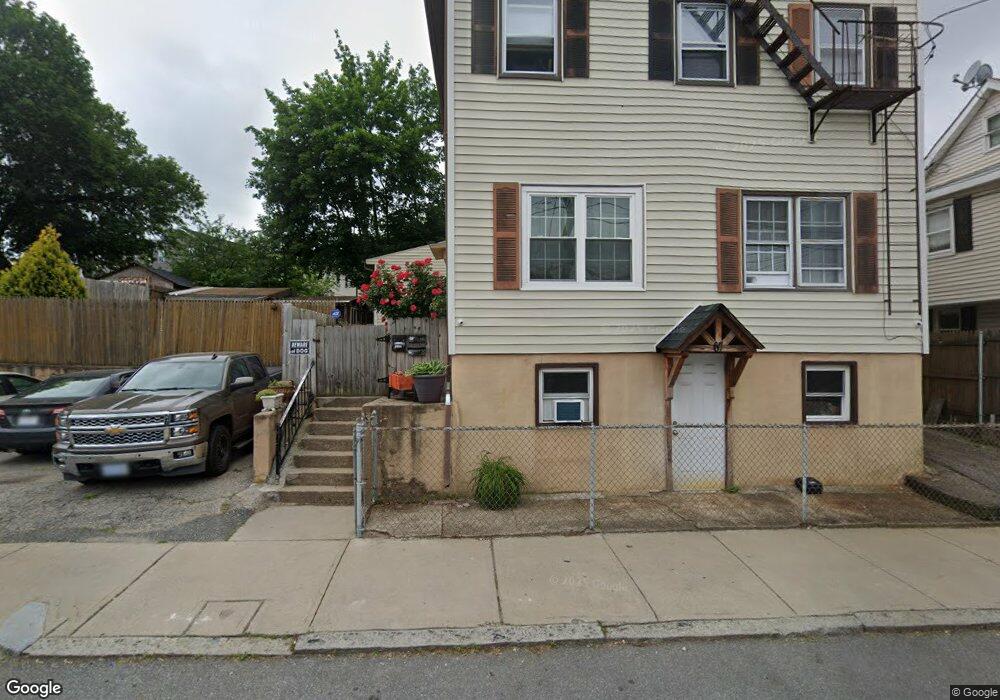
67 Judith St Providence, RI 02909
Silver Lake NeighborhoodEstimated Value: $553,000 - $648,774
7
Beds
3
Baths
3,038
Sq Ft
$200/Sq Ft
Est. Value
About This Home
This home is located at 67 Judith St, Providence, RI 02909 and is currently estimated at $606,944, approximately $199 per square foot. 67 Judith St is a home located in Providence County with nearby schools including Achievement First Promesa and Paul Cuffee Middle School.
Ownership History
Date
Name
Owned For
Owner Type
Purchase Details
Closed on
Aug 26, 2004
Sold by
Sorto Francisco O
Bought by
Rosales Jamie F
Current Estimated Value
Home Financials for this Owner
Home Financials are based on the most recent Mortgage that was taken out on this home.
Original Mortgage
$261,900
Outstanding Balance
$130,045
Interest Rate
6.02%
Mortgage Type
Purchase Money Mortgage
Estimated Equity
$476,899
Create a Home Valuation Report for This Property
The Home Valuation Report is an in-depth analysis detailing your home's value as well as a comparison with similar homes in the area
Home Values in the Area
Average Home Value in this Area
Purchase History
| Date | Buyer | Sale Price | Title Company |
|---|---|---|---|
| Rosales Jamie F | $270,000 | -- |
Source: Public Records
Mortgage History
| Date | Status | Borrower | Loan Amount |
|---|---|---|---|
| Open | Rosales Jamie F | $150,000 | |
| Open | Rosales Jamie F | $261,900 | |
| Previous Owner | Rosales Jamie F | $30,000 |
Source: Public Records
Tax History
| Year | Tax Paid | Tax Assessment Tax Assessment Total Assessment is a certain percentage of the fair market value that is determined by local assessors to be the total taxable value of land and additions on the property. | Land | Improvement |
|---|---|---|---|---|
| 2025 | $3,483 | $461,300 | $131,800 | $329,500 |
| 2024 | $5,683 | $309,700 | $74,200 | $235,500 |
| 2023 | $5,683 | $309,700 | $74,200 | $235,500 |
| 2022 | $5,513 | $309,700 | $74,200 | $235,500 |
| 2021 | $4,728 | $192,500 | $50,100 | $142,400 |
| 2020 | $4,728 | $192,500 | $50,100 | $142,400 |
| 2019 | $4,728 | $192,500 | $50,100 | $142,400 |
| 2018 | $4,839 | $151,400 | $48,600 | $102,800 |
| 2017 | $4,839 | $151,400 | $48,600 | $102,800 |
| 2016 | $4,839 | $151,400 | $48,600 | $102,800 |
| 2015 | $4,518 | $136,500 | $51,600 | $84,900 |
| 2014 | $4,607 | $136,500 | $51,600 | $84,900 |
| 2013 | $4,607 | $136,500 | $51,600 | $84,900 |
Source: Public Records
Map
Nearby Homes
- 160 Magnolia St
- 17 Judith St
- 4 Priscilla Ave
- 15 Judith St
- 108 Roosevelt St
- 66 Progress Ave
- 19 Dora St
- 29 Dunford St
- 79 Priscilla Ave
- 193 Clarence St
- 122 Laban St
- 283 Waldo St
- 102 Ellery St
- 70 Rosedale St Unit 1
- 293 Webster Ave
- 173 Whittier Ave
- 30 Rosedale St
- 139 Messer St
- 69 Sorrento St Unit 71
- 12 Benton St
Your Personal Tour Guide
Ask me questions while you tour the home.