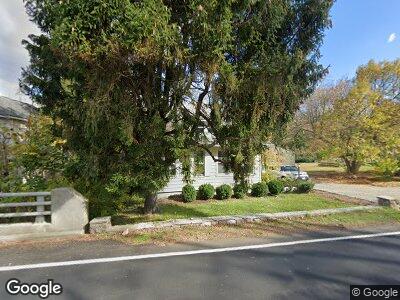
67 Main St Flanders, NJ 07836
Chester-Flanders NeighborhoodEstimated Value: $335,408 - $552,000
--
Bed
--
Bath
988
Sq Ft
$416/Sq Ft
Est. Value
About This Home
This home is located at 67 Main St, Flanders, NJ 07836 and is currently estimated at $411,102, approximately $416 per square foot. 67 Main St is a home located in Morris County with nearby schools including Mt Olive Middle School, Mount Olive High School, and American Christian School.
Ownership History
Date
Name
Owned For
Owner Type
Purchase Details
Closed on
Jul 29, 1998
Sold by
Rulon James M and Rulon Monica
Bought by
Malcolm Brian G and Post Debra M
Current Estimated Value
Home Financials for this Owner
Home Financials are based on the most recent Mortgage that was taken out on this home.
Original Mortgage
$162,000
Interest Rate
6.92%
Create a Home Valuation Report for This Property
The Home Valuation Report is an in-depth analysis detailing your home's value as well as a comparison with similar homes in the area
Home Values in the Area
Average Home Value in this Area
Purchase History
| Date | Buyer | Sale Price | Title Company |
|---|---|---|---|
| Malcolm Brian G | $162,000 | -- |
Source: Public Records
Mortgage History
| Date | Status | Borrower | Loan Amount |
|---|---|---|---|
| Open | Malcolm Brian G | $47,507 | |
| Open | Malcolm Brian G | $275,400 | |
| Closed | Post Debra | $46,000 | |
| Closed | Post Debra | $288,000 | |
| Closed | Post Debra | $35,950 | |
| Closed | Malcolm Brian G | $76,700 | |
| Closed | Malcolm Brian G | $232,000 | |
| Closed | Malcom Brian G | $20,000 | |
| Closed | Malcolm Brian G | $34,000 | |
| Closed | Malcolm Brian G | $162,000 |
Source: Public Records
Tax History Compared to Growth
Tax History
| Year | Tax Paid | Tax Assessment Tax Assessment Total Assessment is a certain percentage of the fair market value that is determined by local assessors to be the total taxable value of land and additions on the property. | Land | Improvement |
|---|---|---|---|---|
| 2024 | $7,182 | $218,500 | $138,200 | $80,300 |
| 2023 | $7,182 | $218,500 | $138,200 | $80,300 |
| 2022 | $7,337 | $218,500 | $138,200 | $80,300 |
| 2021 | $7,337 | $218,500 | $138,200 | $80,300 |
| 2020 | $7,239 | $218,500 | $138,200 | $80,300 |
| 2019 | $7,215 | $218,500 | $138,200 | $80,300 |
| 2018 | $7,145 | $218,500 | $138,200 | $80,300 |
| 2017 | $7,020 | $218,500 | $138,200 | $80,300 |
| 2016 | $6,798 | $218,500 | $138,200 | $80,300 |
| 2015 | $6,957 | $218,500 | $138,200 | $80,300 |
| 2014 | $6,964 | $218,500 | $138,200 | $80,300 |
Source: Public Records
Map
Nearby Homes
- 19 Park Place
- 143 Crenshaw Dr
- 44 Crenshaw Dr
- 9 Watson Way
- 11 Main St
- 18 Beecher Ln
- 4 Allyson Rd
- 150 U S Highway 206
- 144 Clover Hill Dr
- 37 Warwick Rd
- 41 Warwick Rd
- 31 Hillery Dr
- 29 Tinc Rd
- 9 Harwich Rd
- 31 Devonshire Terrace
- 7 Schoolhouse Ln
- 138 Bartley Flanders Rd
- 16 Edward Dr
- 7 Brewster Place
- 8 Reger Rd