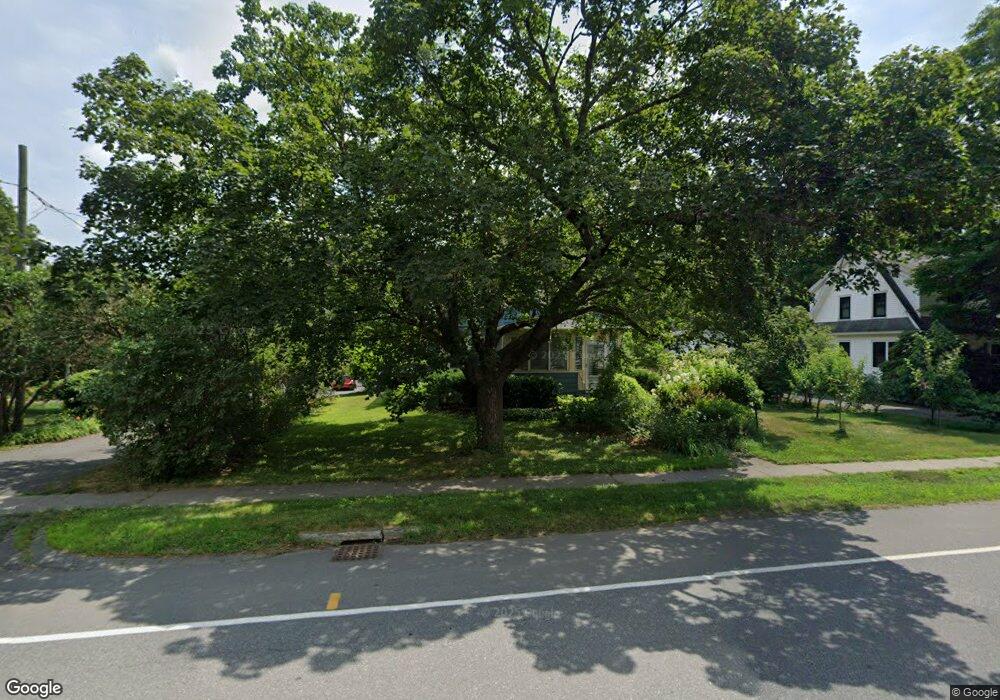
67 Main St Montague, MA 01351
Estimated Value: $396,000 - $507,000
4
Beds
2
Baths
1,628
Sq Ft
$270/Sq Ft
Est. Value
About This Home
This home is located at 67 Main St, Montague, MA 01351 and is currently estimated at $440,334, approximately $270 per square foot. 67 Main St is a home located in Franklin County with nearby schools including Turners Fall High School.
Ownership History
Date
Name
Owned For
Owner Type
Purchase Details
Closed on
Sep 2, 2015
Sold by
Sheren Paul E and Romero Miguel A
Bought by
Watson Bruce E and Kumble Julie
Current Estimated Value
Home Financials for this Owner
Home Financials are based on the most recent Mortgage that was taken out on this home.
Original Mortgage
$100,000
Outstanding Balance
$32,722
Interest Rate
4.07%
Mortgage Type
New Conventional
Estimated Equity
$407,612
Purchase Details
Closed on
Feb 14, 1996
Sold by
Braman David R and Braman Stephanie A
Bought by
Romero Miguel A
Home Financials for this Owner
Home Financials are based on the most recent Mortgage that was taken out on this home.
Original Mortgage
$92,000
Interest Rate
6.99%
Mortgage Type
Purchase Money Mortgage
Create a Home Valuation Report for This Property
The Home Valuation Report is an in-depth analysis detailing your home's value as well as a comparison with similar homes in the area
Home Values in the Area
Average Home Value in this Area
Purchase History
| Date | Buyer | Sale Price | Title Company |
|---|---|---|---|
| Watson Bruce E | $235,000 | -- | |
| Watson Bruce E | $235,000 | -- | |
| Romero Miguel A | $115,000 | -- | |
| Romero Miguel A | $115,000 | -- |
Source: Public Records
Mortgage History
| Date | Status | Borrower | Loan Amount |
|---|---|---|---|
| Open | Watson Bruce E | $100,000 | |
| Closed | Watson Bruce E | $100,000 | |
| Previous Owner | Romero Miguel A | $85,351 | |
| Previous Owner | Romero Miguel A | $92,000 |
Source: Public Records
Tax History
| Year | Tax Paid | Tax Assessment Tax Assessment Total Assessment is a certain percentage of the fair market value that is determined by local assessors to be the total taxable value of land and additions on the property. | Land | Improvement |
|---|---|---|---|---|
| 2025 | $4,888 | $321,400 | $96,500 | $224,900 |
| 2024 | $4,740 | $301,900 | $96,500 | $205,400 |
| 2023 | $4,645 | $296,800 | $96,500 | $200,300 |
| 2022 | $4,389 | $261,900 | $96,500 | $165,400 |
| 2021 | $4,583 | $262,800 | $105,600 | $157,200 |
| 2020 | $4,463 | $254,000 | $105,600 | $148,400 |
| 2019 | $4,382 | $255,800 | $114,400 | $141,400 |
| 2018 | $4,238 | $248,000 | $104,900 | $143,100 |
| 2017 | $3,781 | $226,800 | $104,900 | $121,900 |
| 2016 | $3,642 | $206,800 | $89,300 | $117,500 |
| 2015 | $3,507 | $206,800 | $89,300 | $117,500 |
| 2014 | $3,379 | $206,800 | $89,300 | $117,500 |
Source: Public Records
Map
Nearby Homes
- 27 West St
- 35 A N Leverett Rd
- 10 Hannabrooke Dr
- 0 Pocumtuck Dr Unit 73379330
- 61 Randall Wood Dr
- 26 Falls Rd
- 59 N Hillside Rd
- 18 Stage Rd
- 8 Craig Ave
- 183 Millers Falls Rd
- 2 Alice St
- Lots 1-4 Kavanaugh Ln
- 0 Dudleyville Rd
- 208 Greenfield Rd
- 709 Fairway Ave
- 8 Country Club Ln
- 45 Millers Falls Rd
- 63 James St
- 175 Hope St
- 73 Washington St
- 69 Main St
- 63 Main St
- 1 South St Unit J
- 5 Welch Ln
- 68 Main St
- 71 Main St
- 8 Algy
- 66 Main St
- 59 Main St Unit A
- 59 Main St Unit B
- 59 Main St Unit 59A
- 75 Main St
- 70 Main St
- 0 Main St
- 0 Old Sunderland Rd Unit 72387546
- 0 Old Sunderland Rd Unit 72330504
- 0 Old Sunderland Rd Unit 72888188
- 0 Old Sunderland Rd Unit 72741283
- 3 South St Unit J
- 55 Main St
Your Personal Tour Guide
Ask me questions while you tour the home.