Estimated Value: $104,000 - $169,000
3
Beds
2
Baths
1,488
Sq Ft
$98/Sq Ft
Est. Value
About This Home
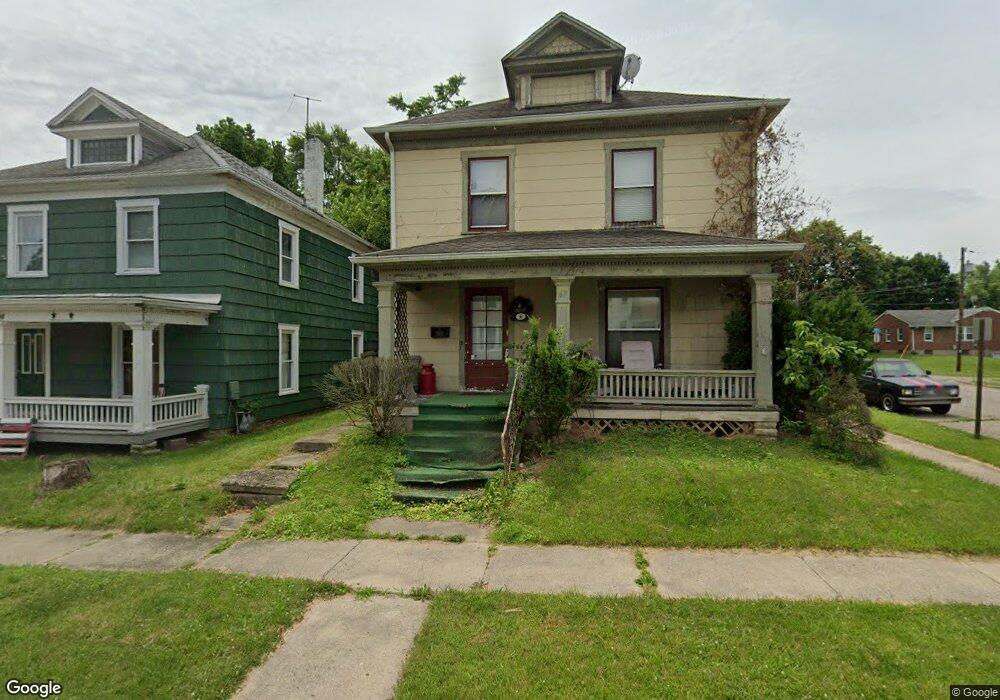
This home is located at 67 Maple St, Xenia, OH 45385 and is currently estimated at $146,206, approximately $98 per square foot. 67 Maple St is a home located in Greene County with nearby schools including Xenia High School, Summit Academy Community School for Alternative Learners - Xenia, and Legacy Christian Academy.
Ownership History
Date
Name
Owned For
Owner Type
Purchase Details
Closed on
Jul 31, 2024
Sold by
Spahr Julie and Terry Julie A
Bought by
Spahr Michael R
Current Estimated Value
Purchase Details
Closed on
Jun 19, 1997
Sold by
Hutson Paul F
Bought by
Michael and Spahr Julie
Home Financials for this Owner
Home Financials are based on the most recent Mortgage that was taken out on this home.
Original Mortgage
$73,400
Interest Rate
8.01%
Mortgage Type
FHA
Create a Home Valuation Report for This Property
The Home Valuation Report is an in-depth analysis detailing your home's value as well as a comparison with similar homes in the area
Home Values in the Area
Average Home Value in this Area
Purchase History
| Date | Buyer | Sale Price | Title Company |
|---|---|---|---|
| Spahr Michael R | -- | None Listed On Document | |
| Michael | $73,900 | -- |
Source: Public Records
Mortgage History
| Date | Status | Borrower | Loan Amount |
|---|---|---|---|
| Previous Owner | Michael | $73,400 |
Source: Public Records
Tax History
| Year | Tax Paid | Tax Assessment Tax Assessment Total Assessment is a certain percentage of the fair market value that is determined by local assessors to be the total taxable value of land and additions on the property. | Land | Improvement |
|---|---|---|---|---|
| 2025 | $1,157 | $27,220 | $2,560 | $24,660 |
| 2024 | $1,157 | $27,220 | $2,560 | $24,660 |
| 2023 | $1,165 | $27,220 | $2,560 | $24,660 |
| 2022 | $1,031 | $20,560 | $2,040 | $18,520 |
| 2021 | $1,045 | $20,560 | $2,040 | $18,520 |
| 2020 | $1,014 | $20,560 | $2,040 | $18,520 |
| 2019 | $1,172 | $22,650 | $1,980 | $20,670 |
| 2018 | $1,177 | $22,650 | $1,980 | $20,670 |
| 2017 | $1,143 | $22,650 | $1,980 | $20,670 |
| 2016 | $1,115 | $21,070 | $1,980 | $19,090 |
| 2015 | $1,118 | $21,070 | $1,980 | $19,090 |
| 2014 | $1,071 | $21,070 | $1,980 | $19,090 |
Source: Public Records
Map
Nearby Homes
Your Personal Tour Guide
Ask me questions while you tour the home.